Logs and Dashboard
Logs and Dashboard
For this section, we will look at different types of logs and dashboards.
- Login to the FortiADC (FAD-Primary) with the username
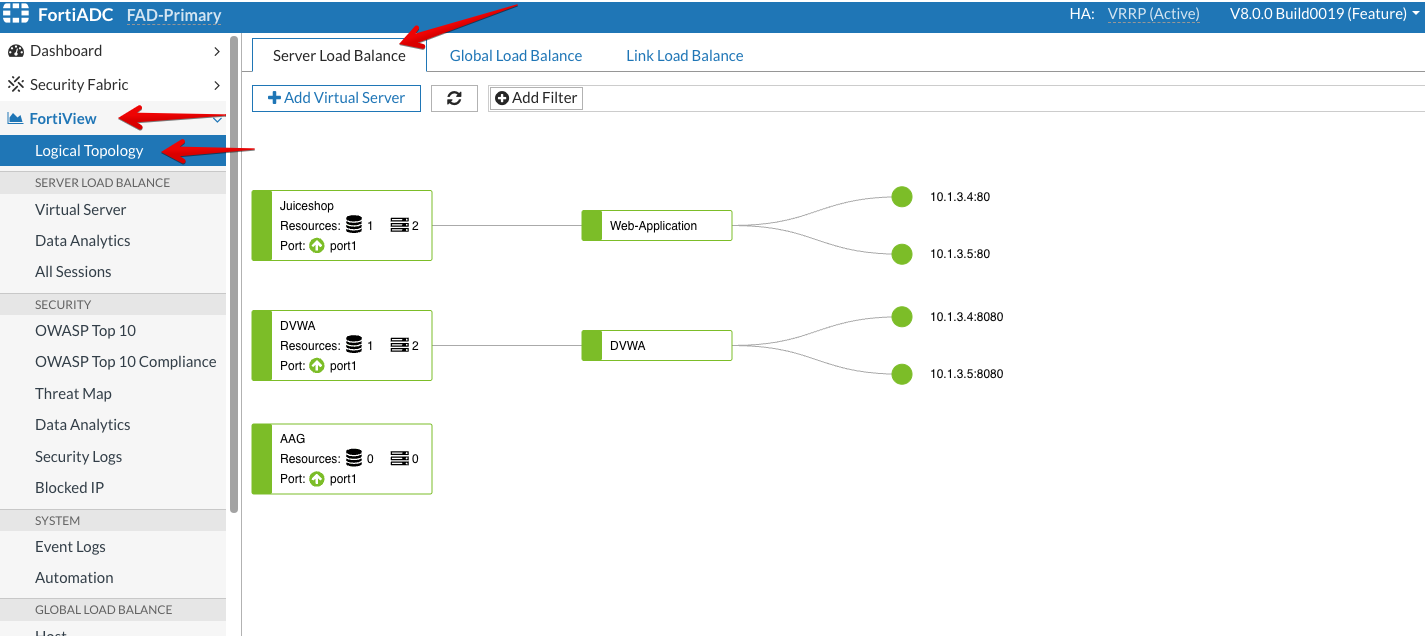
xperts2025and passwordAppSec-Xp3rts2025! - We will look at the Logical Topology of the FortiADC network structure showing the FortiADC’s Virtual Servers, Server Pools and Real Servers under the respective Server Pools.
- Click FortiView and then, select Logical Topology and you will be able to see Virtual Servers under Server Load Balance tab.
- From the below screenshot, we can see both Juiceshop and DVWA Virtual Servers.
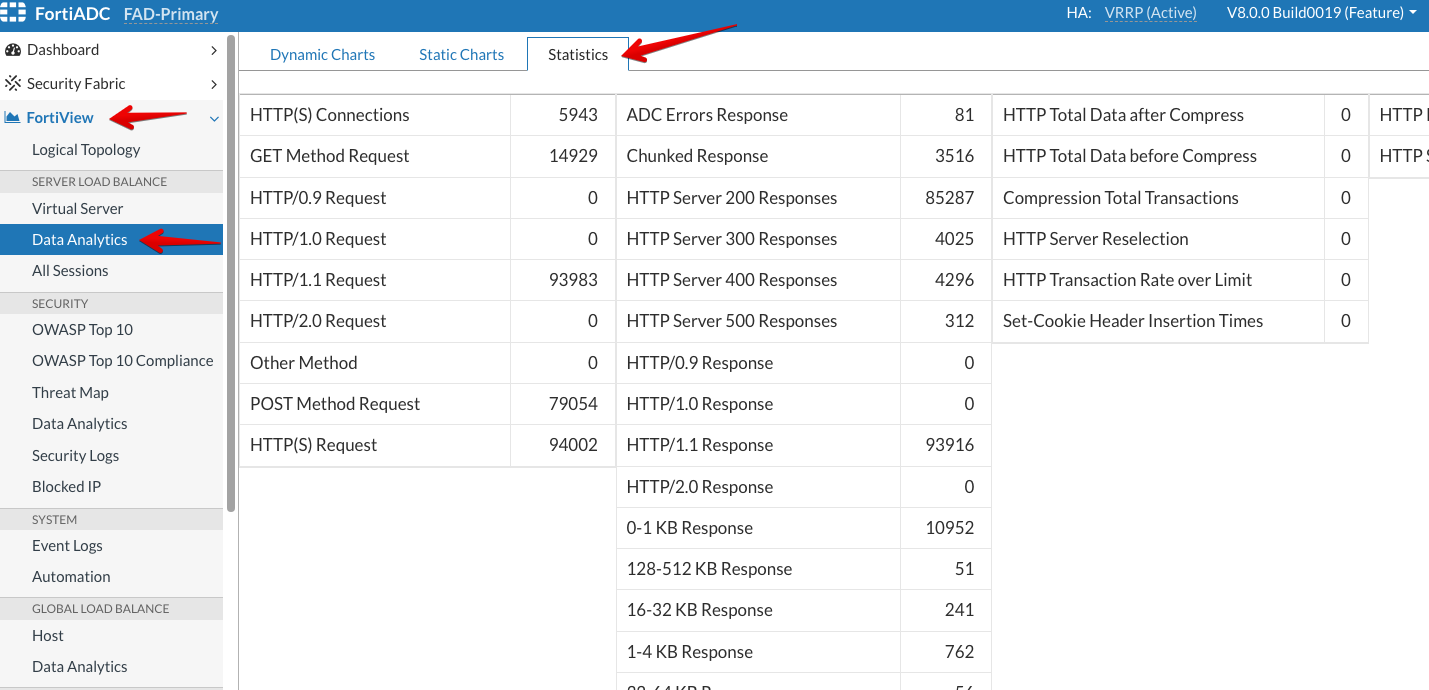
- Now, we will look at the Statistics status of the whole VDOM. For that, go to FortiView → Data Analytics under Server Load Balance tab.
- We can see details about number of HTTP(S) Connections, number of GET or POST method requests, HTTP Server Response codes like 200, 400, 500 etc.
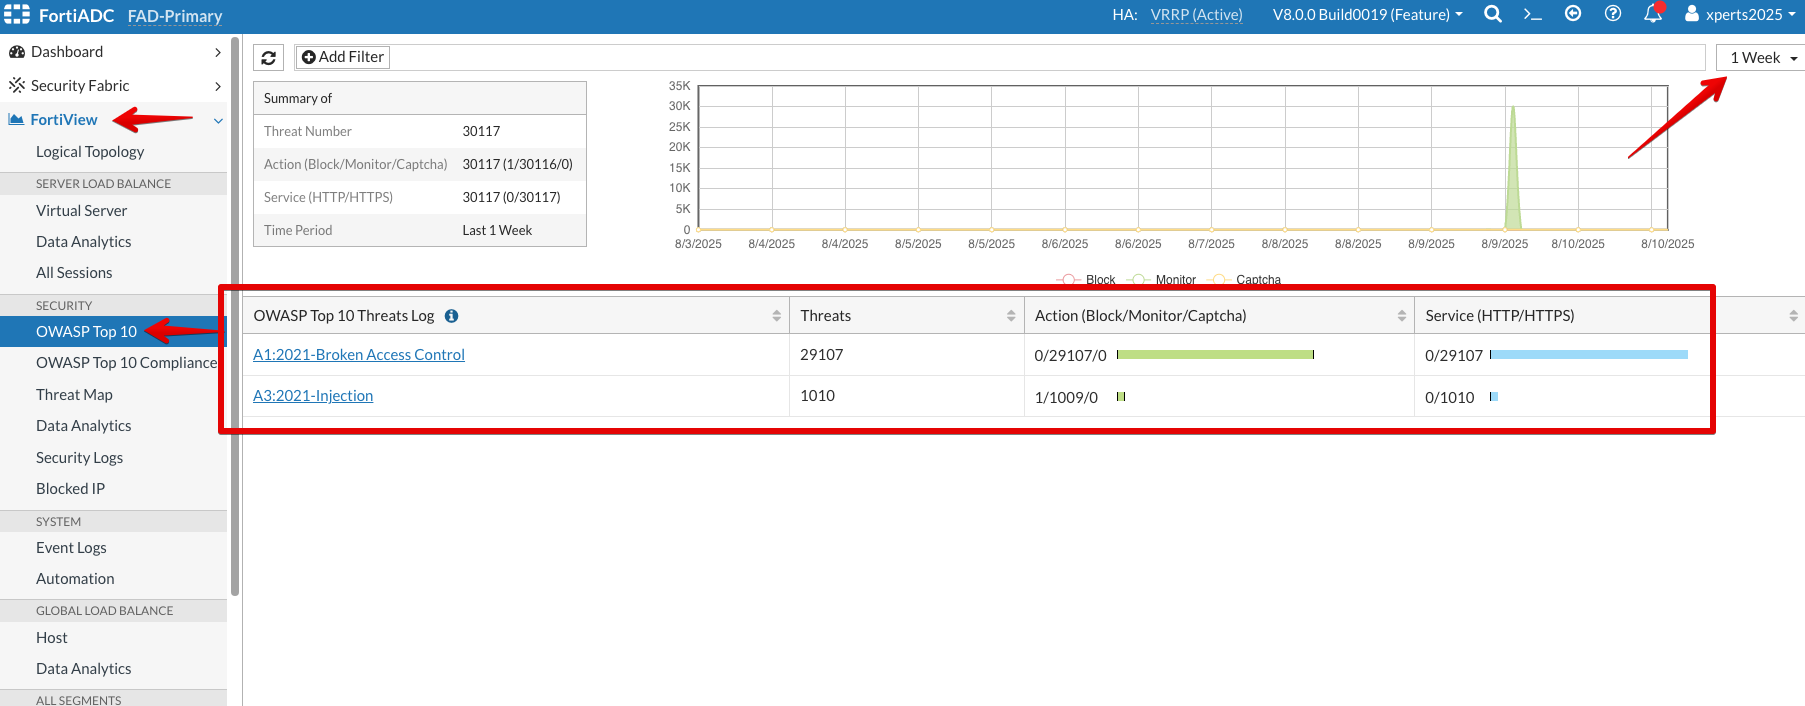
- Through the FortiView → OWASP Top 10 page, we can monitor threats by OWASP Top 10 to analyze the 10 most critical attacks targeted to our application upto 1 week.