Task 3
Task 2: FortiAnalyzer Integration
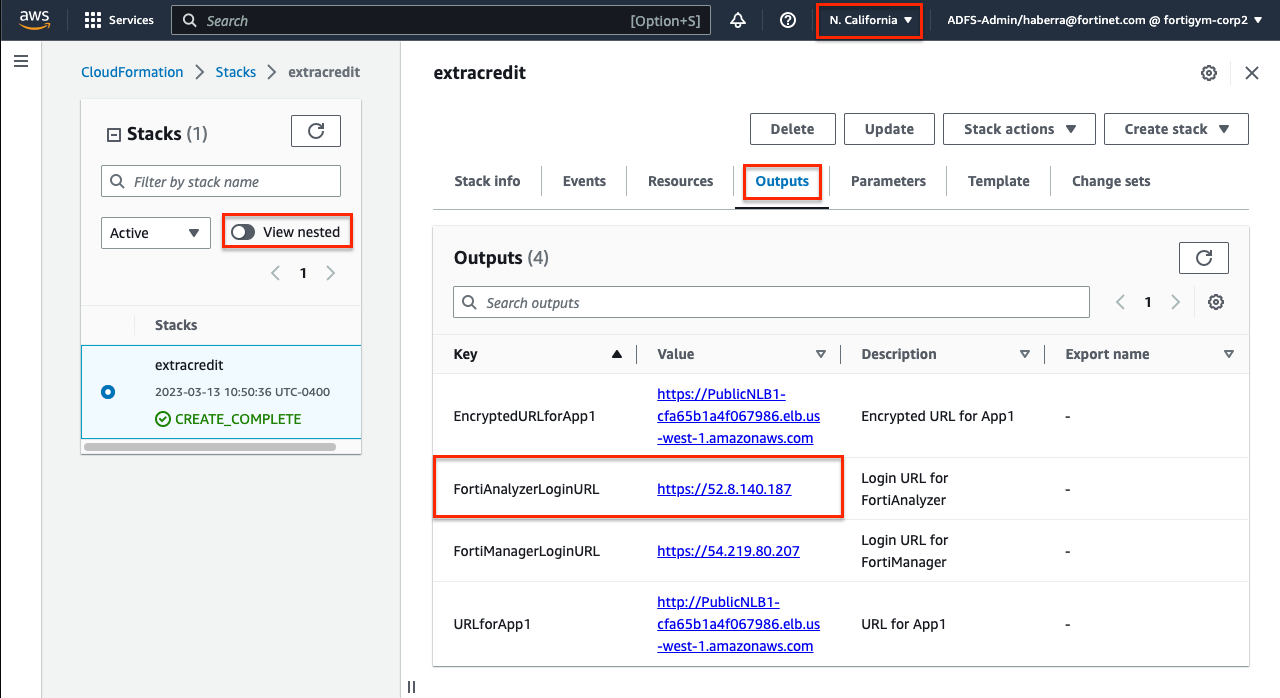
- In the AWS CloudFormation console, make sure you are in the us-west-1 (N. California) region, then toggle the view nested button to off > then select the stack name > and on the details pane select the outputs tab. You should see the output for FortiAnalyzerLoginURL. Login to the FortiAnalyzer with the username
adminand the passwordFORTInet123!.
- In the AWS CloudFormation console, make sure you are in the us-west-1 (N. California) region, then toggle the view nested button to off > then select the stack name > and on the details pane select the outputs tab. You should see the output for FortiAnalyzerLoginURL. Login to the FortiAnalyzer with the username
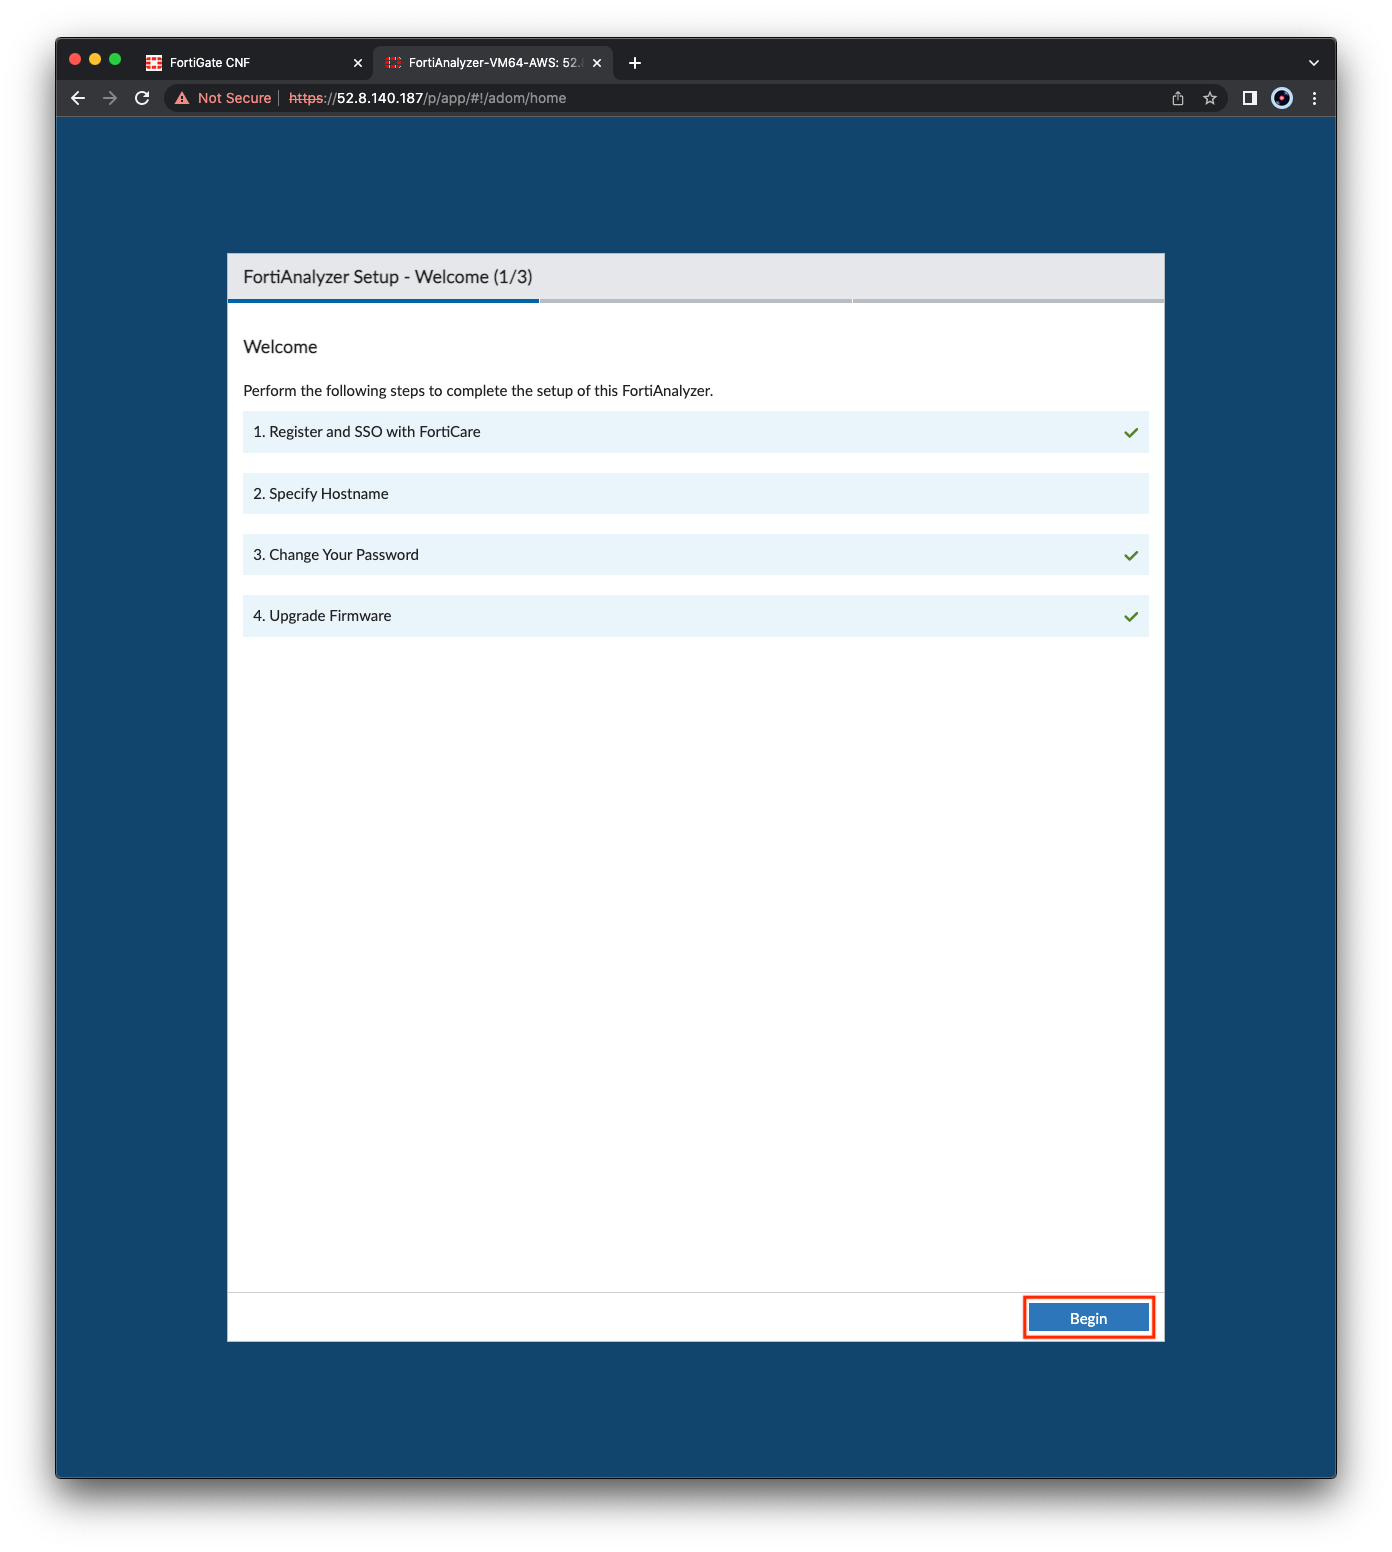
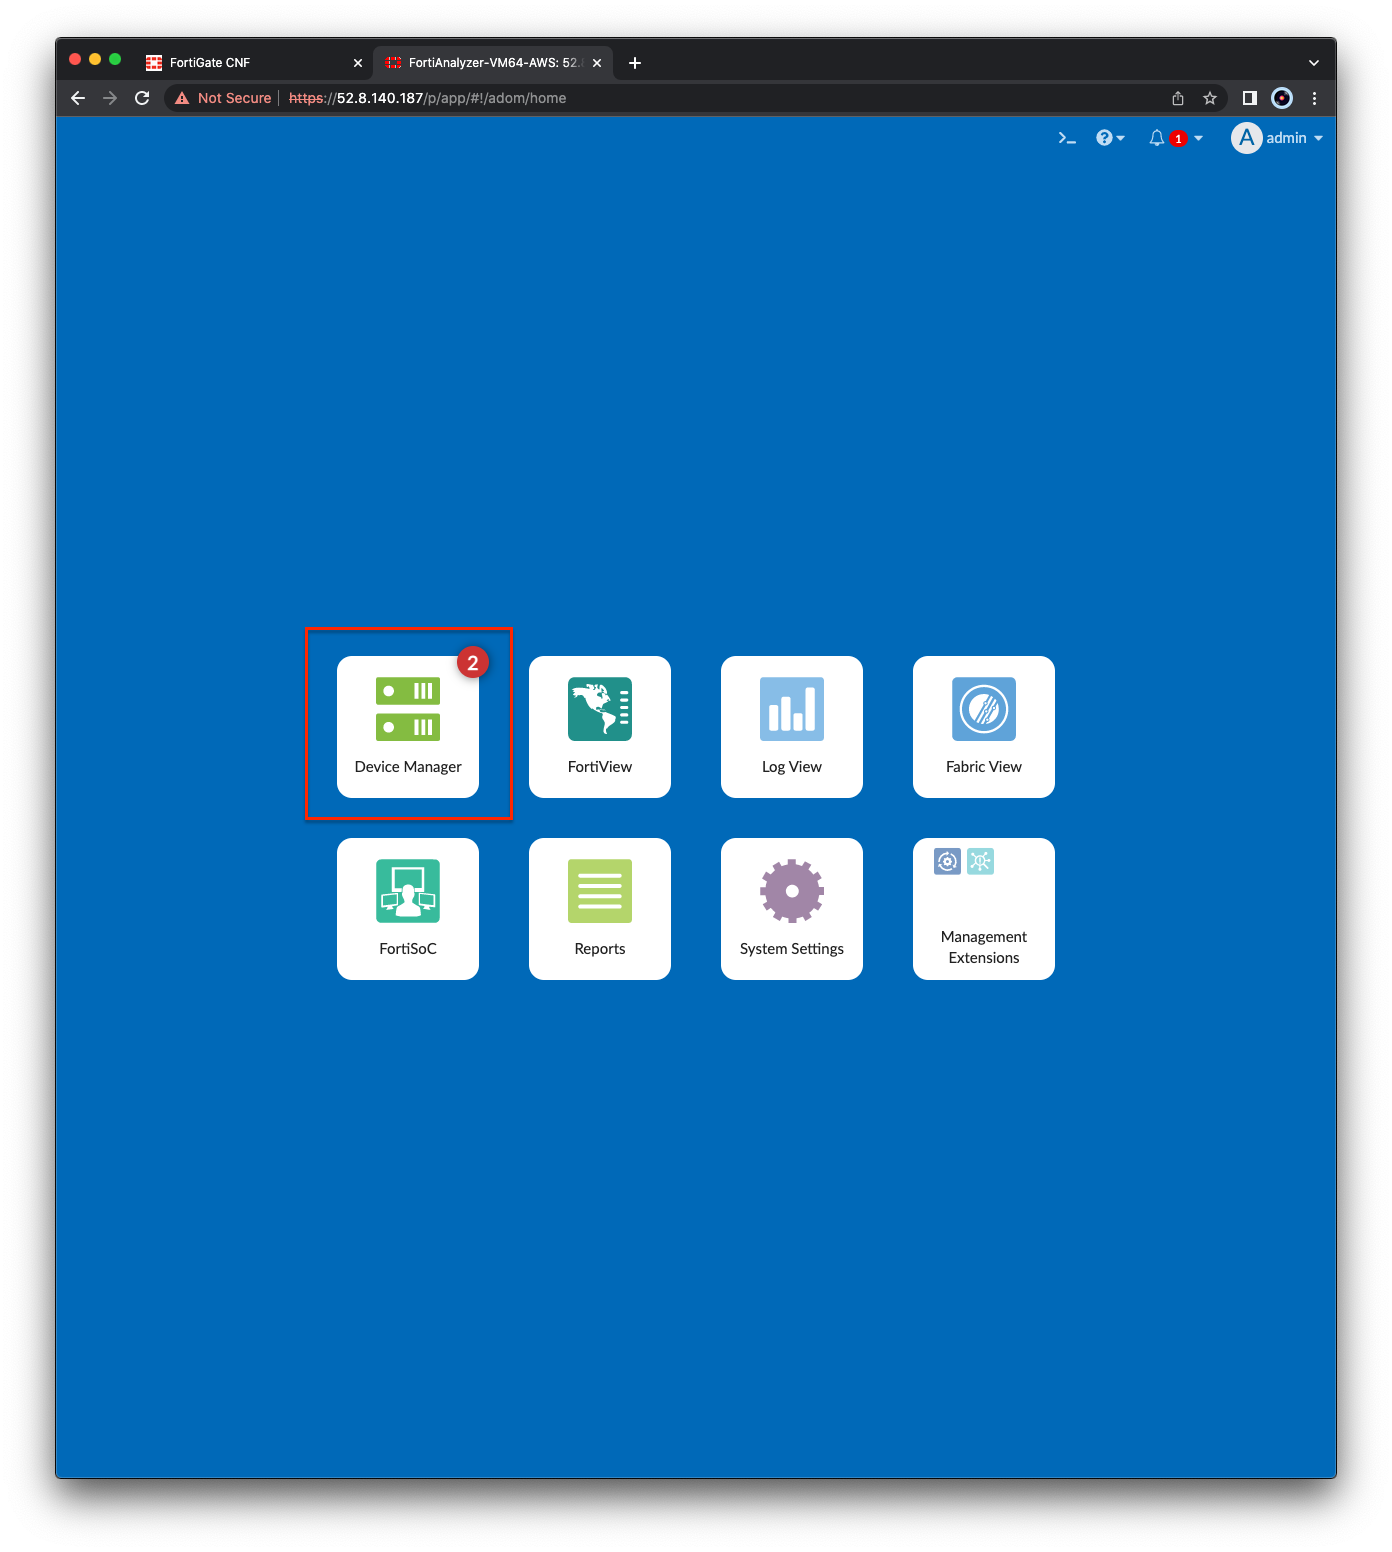
- In the FortiAnalyzer GUI for the first login, you will be prompted to complete the setup wizard. Click Begin, Next, and Finish. Then on the home page, select Device Manager.
Info
Note: By default, FortiAnalyzer will be deployed with a self-signed certificate. You will see browser warnings for this and need to accept this to login successfully.
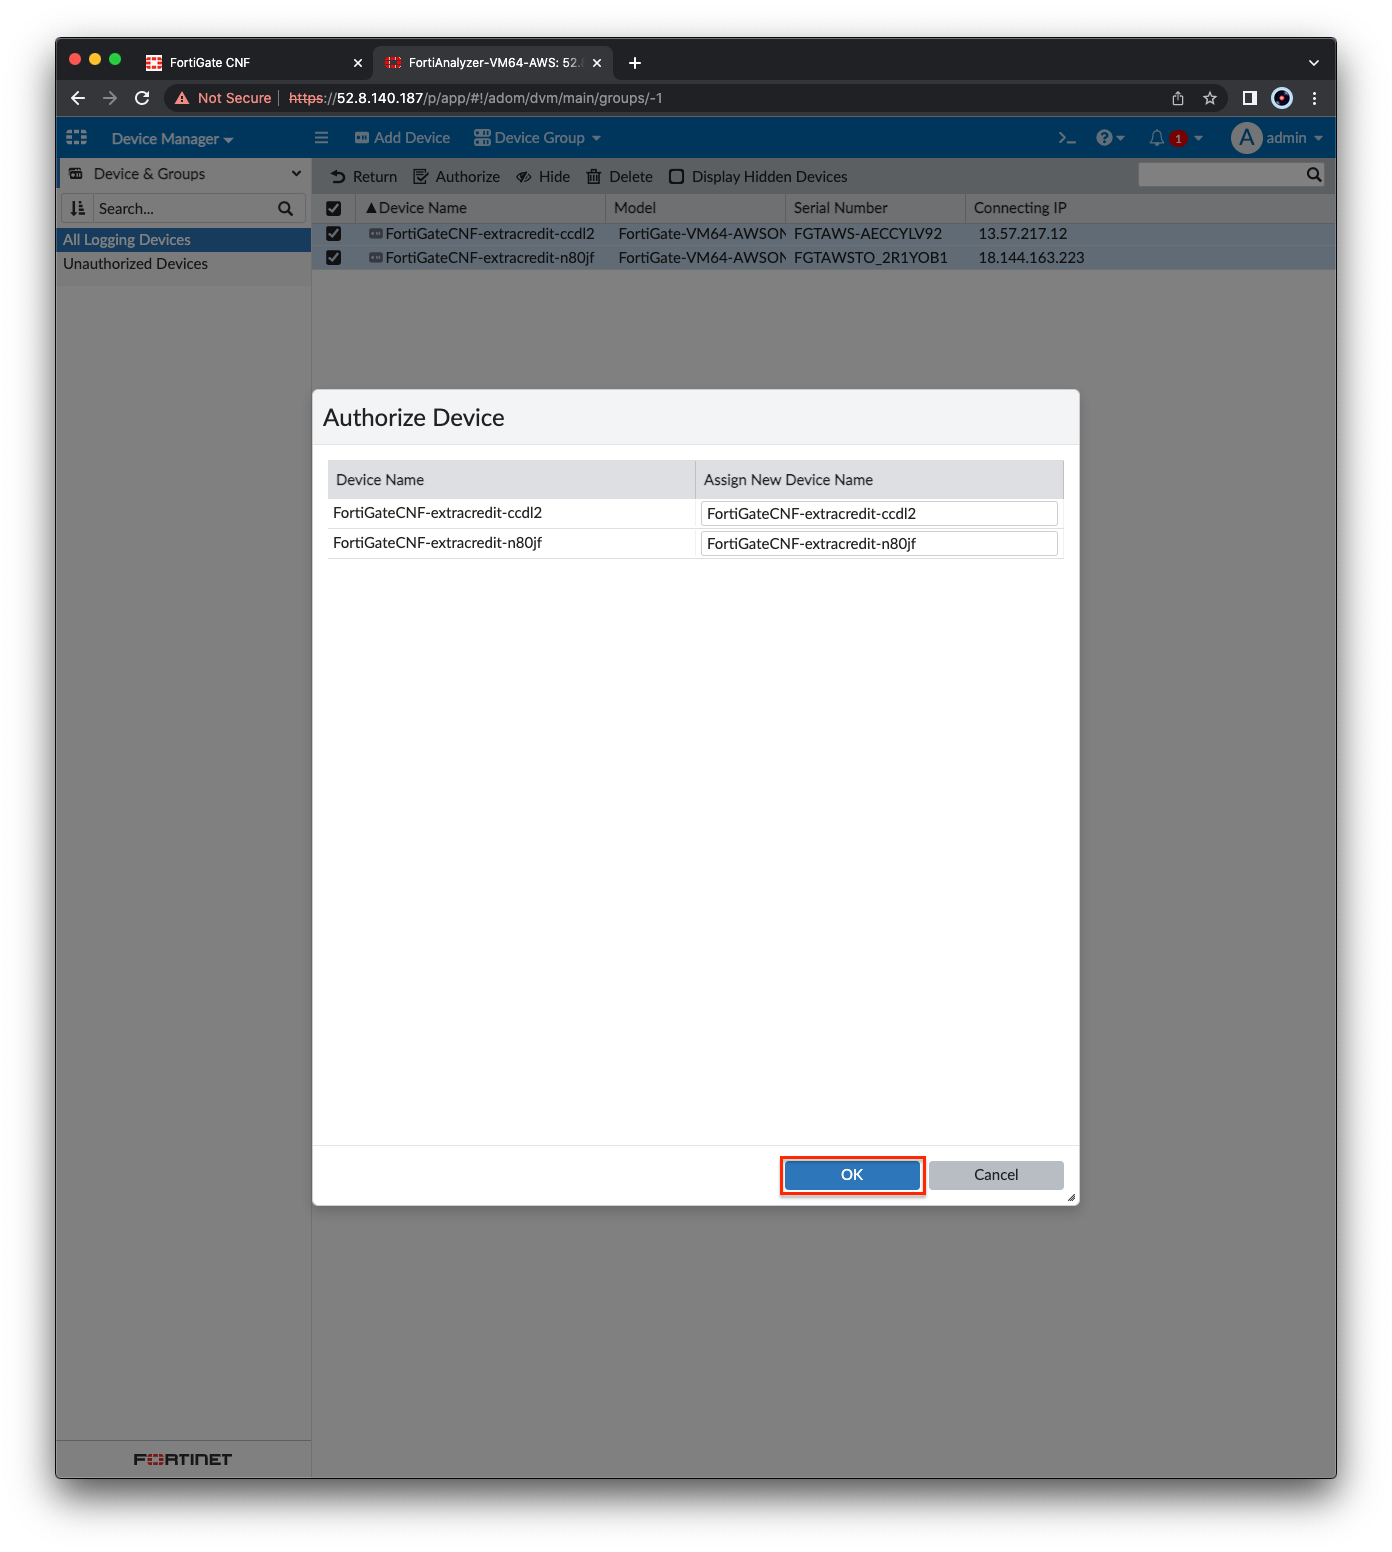
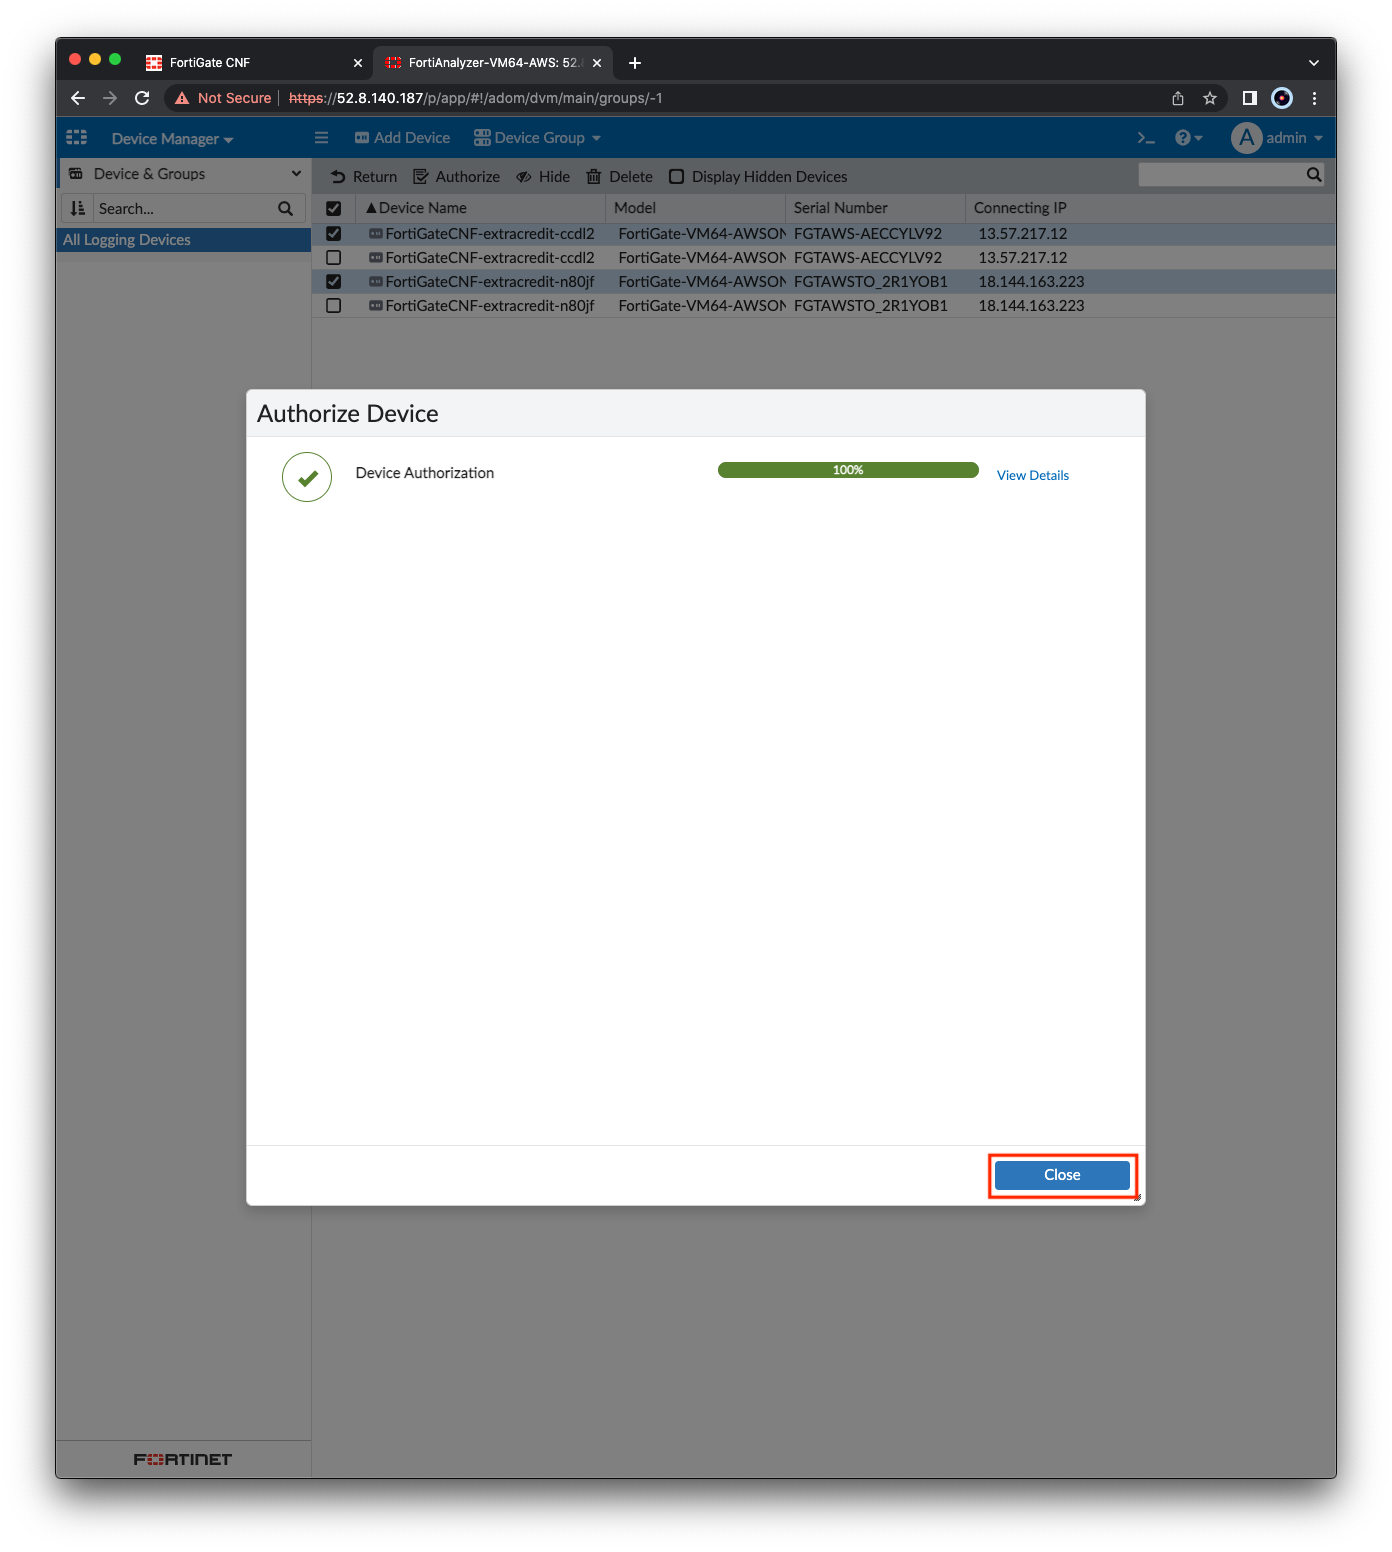
- At the top right, click the Bell icon and select 2 Unauthorized device(s).. Then select both devices and click Authorize, on the next page click OK. Once complete, click Close.
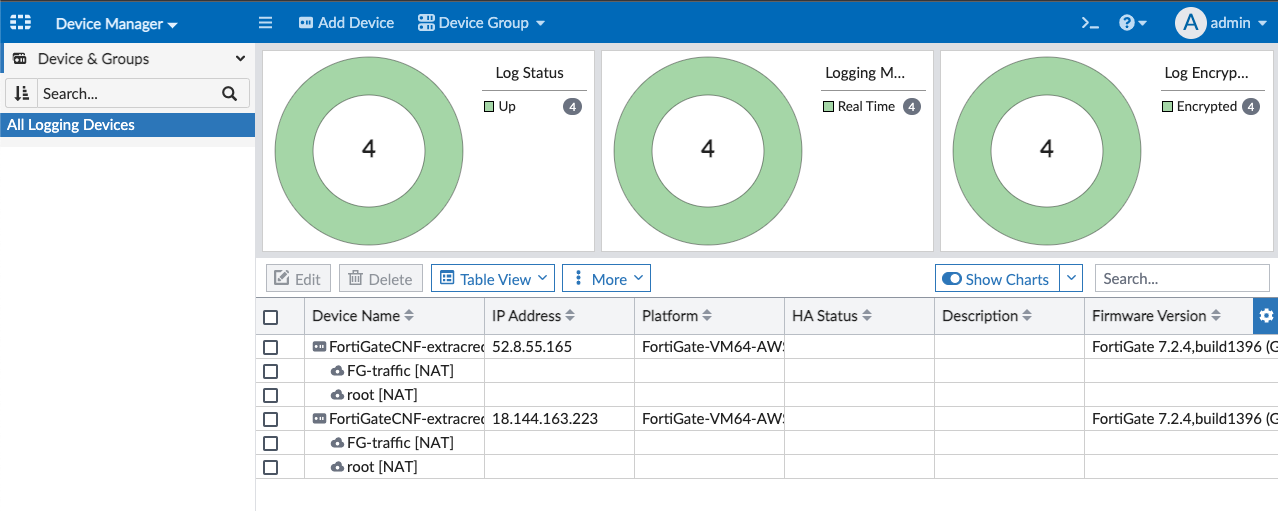
- Once logs have been received from all CNF instances, the widgets should all show green in a few minutes.
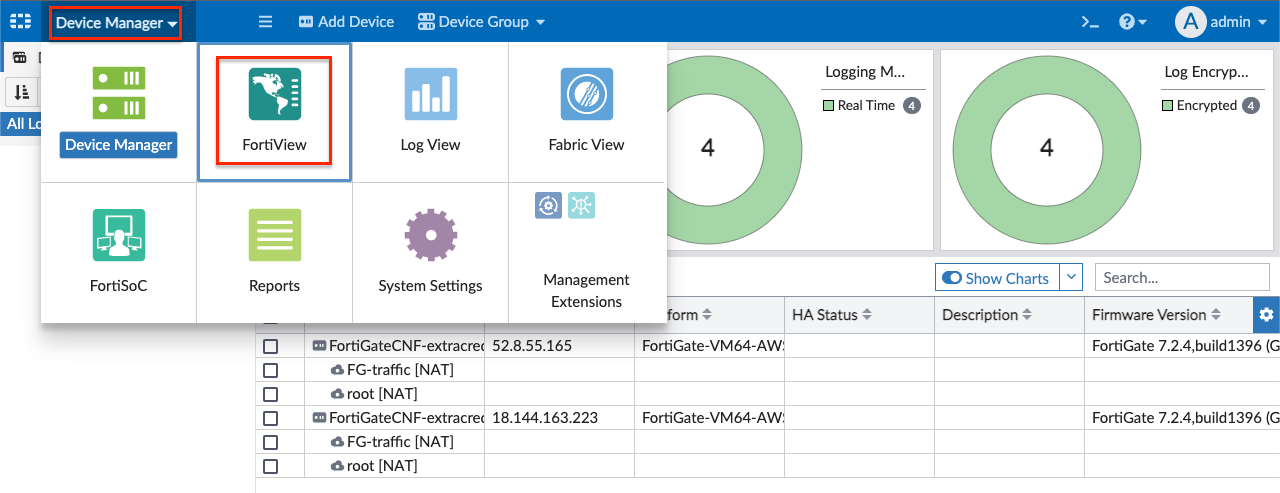
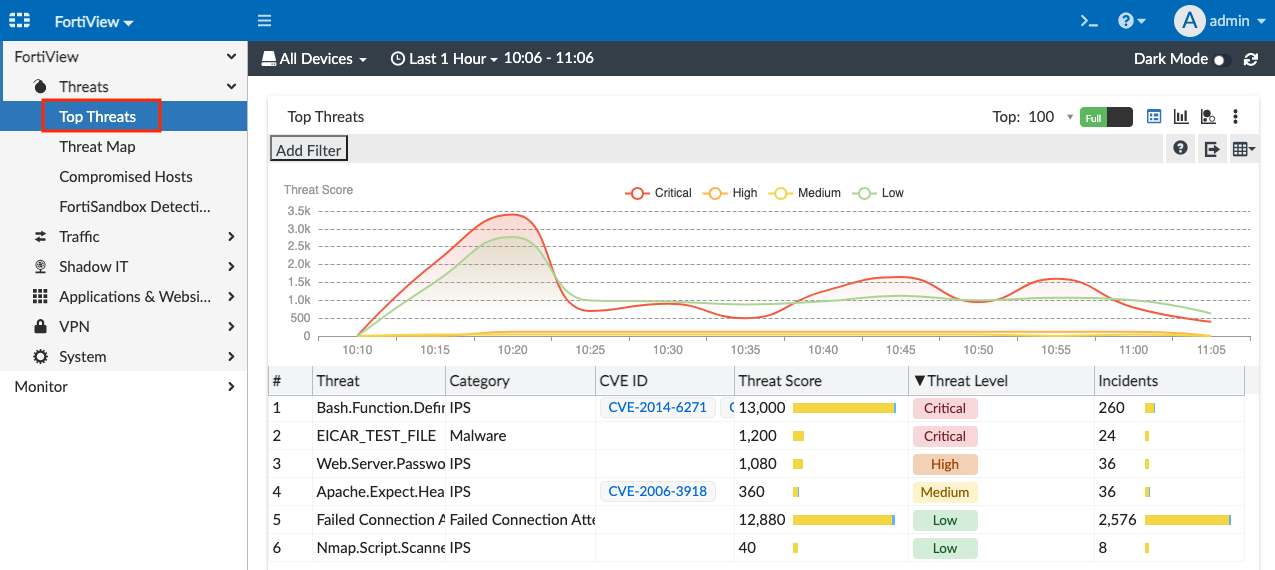
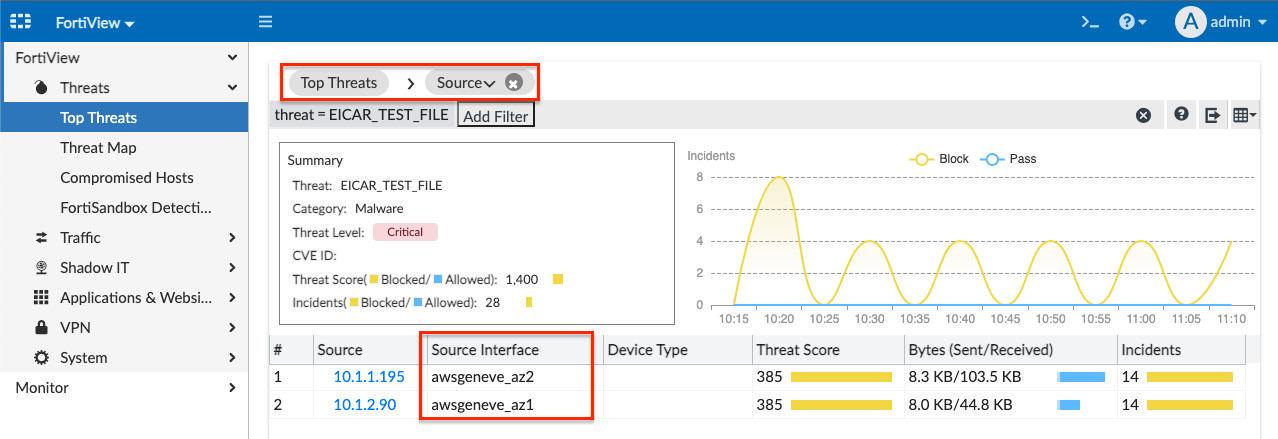
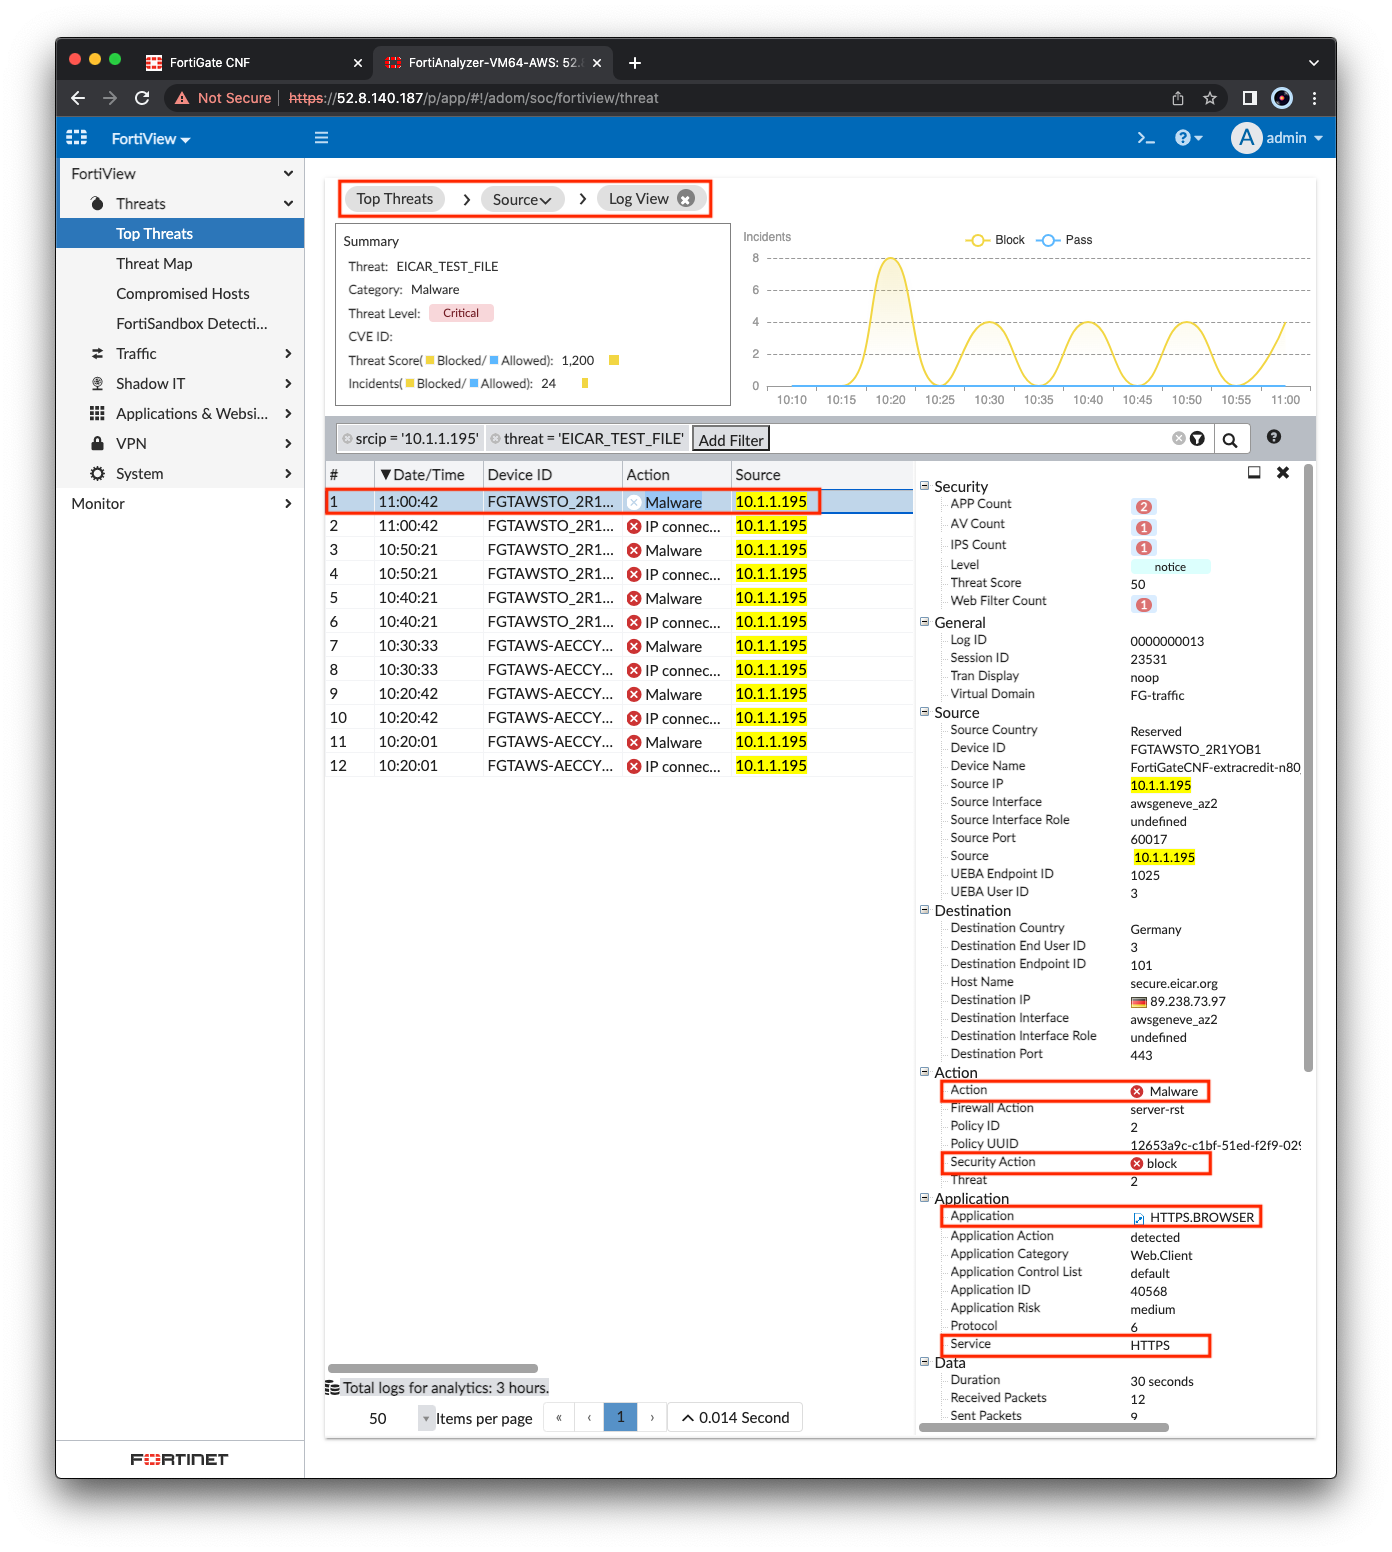
- In the top left, click Device Manager then click FortiView and look at Top Threats. In ~15-20 minutes, logs should be generated by the EC2 instances in the Application VPC and the Nikto Scanner instance in the Management VPC. You can drill down on the widgets to get more information. Click on Eicar_TEST_File to see the source of the malware, then click the interface name to get to the formatted logs. Clicking on a log entry will bring up the log details.
Tip
Note: This malware was detected and blocked over a TLS encrypted connection because SSL MitM is enabled on the outbound policy.
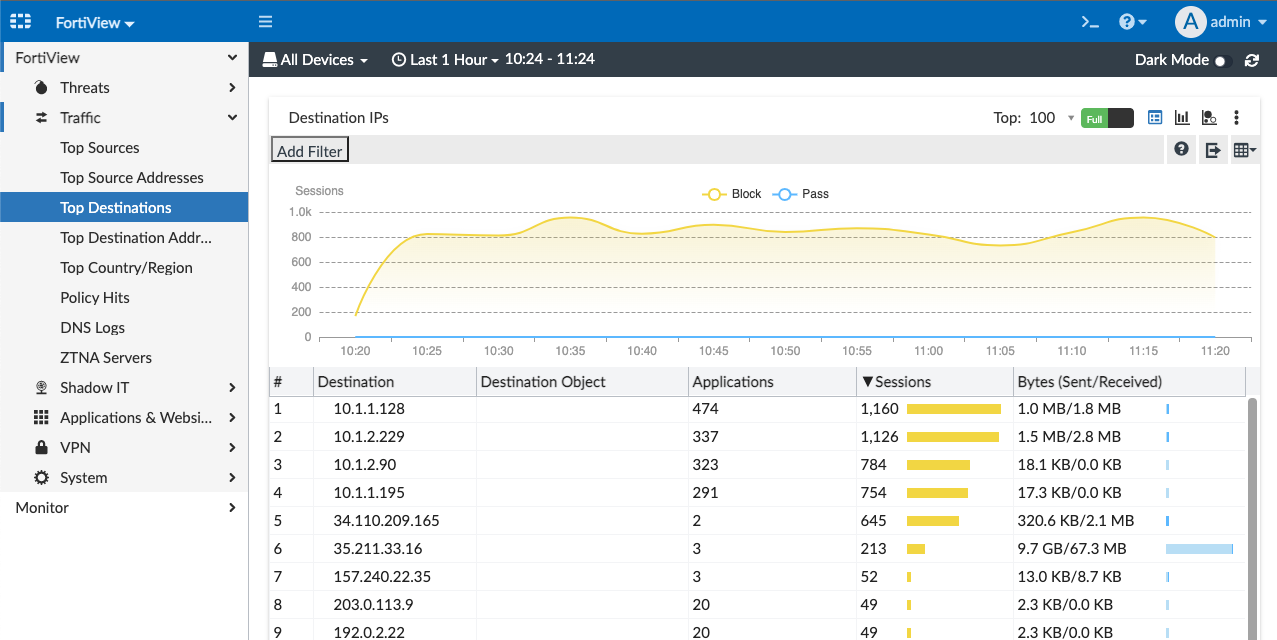
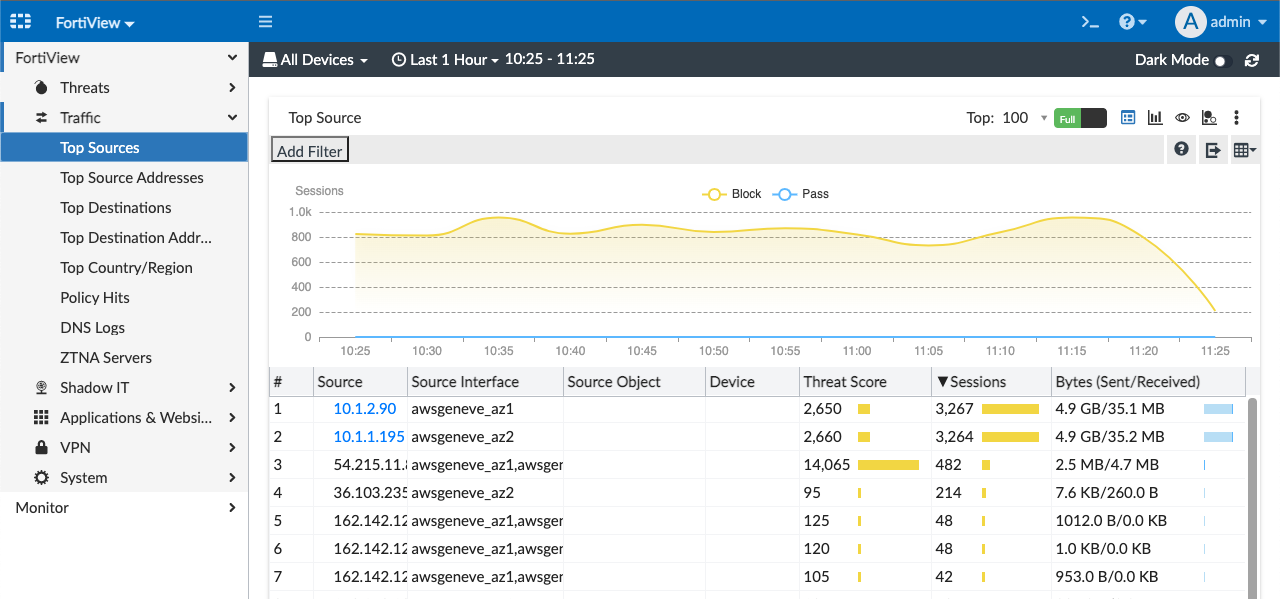
- Click on the following FortiView pages to see additional drill down widgets and click through the results to see more:
- Traffic -> Top Sources
- Traffic -> Top Destinations
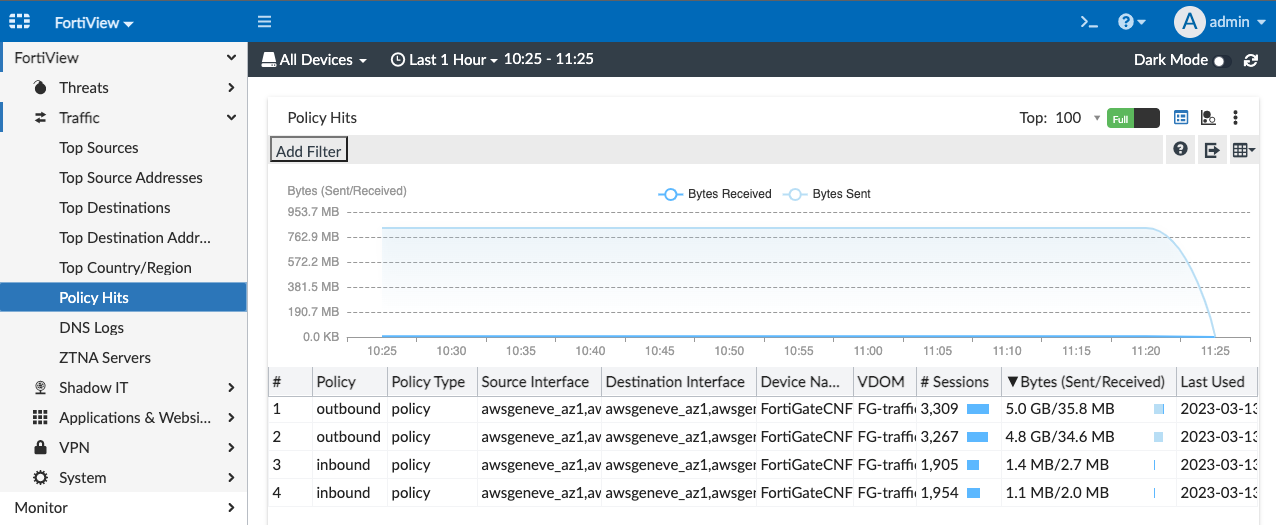
- Traffic -> Policy Hits
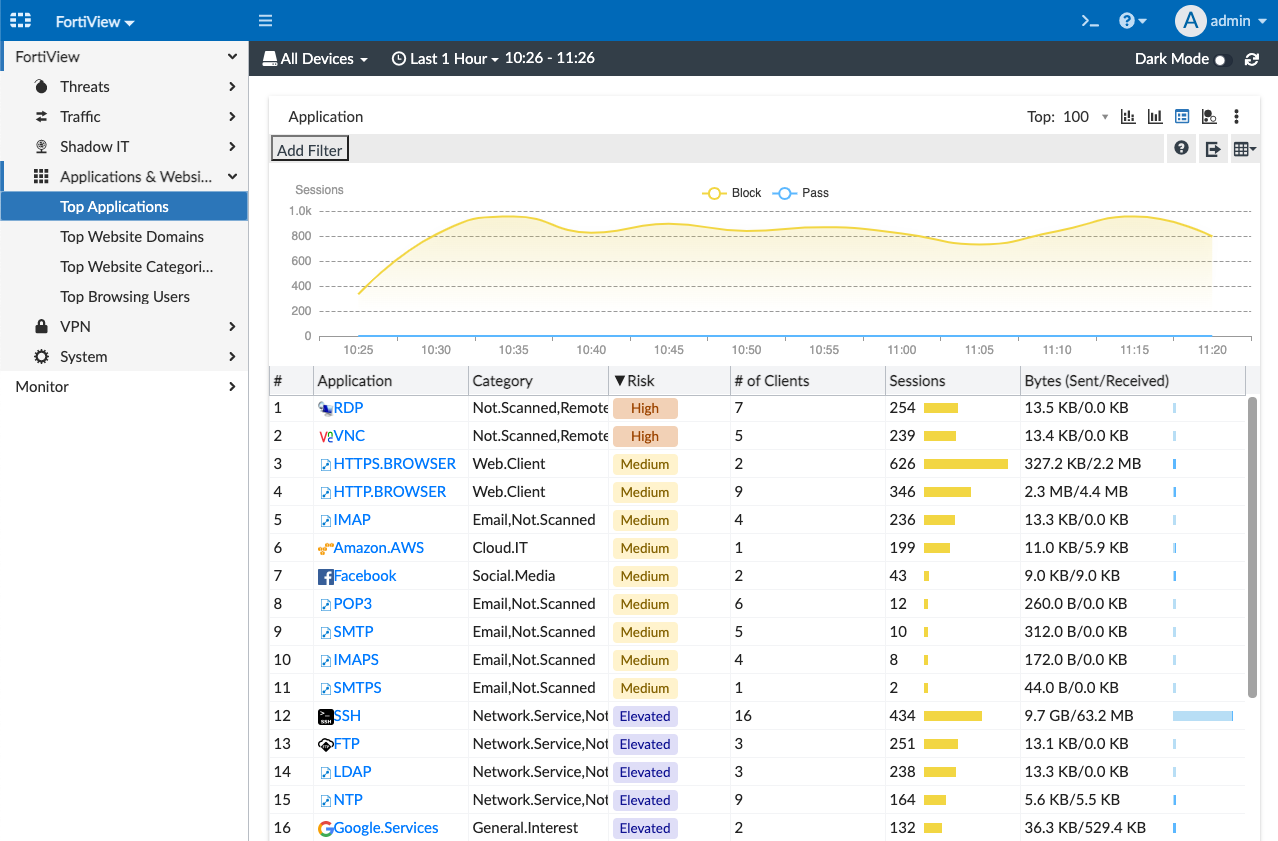
- Applications & Websites -> Top Applications
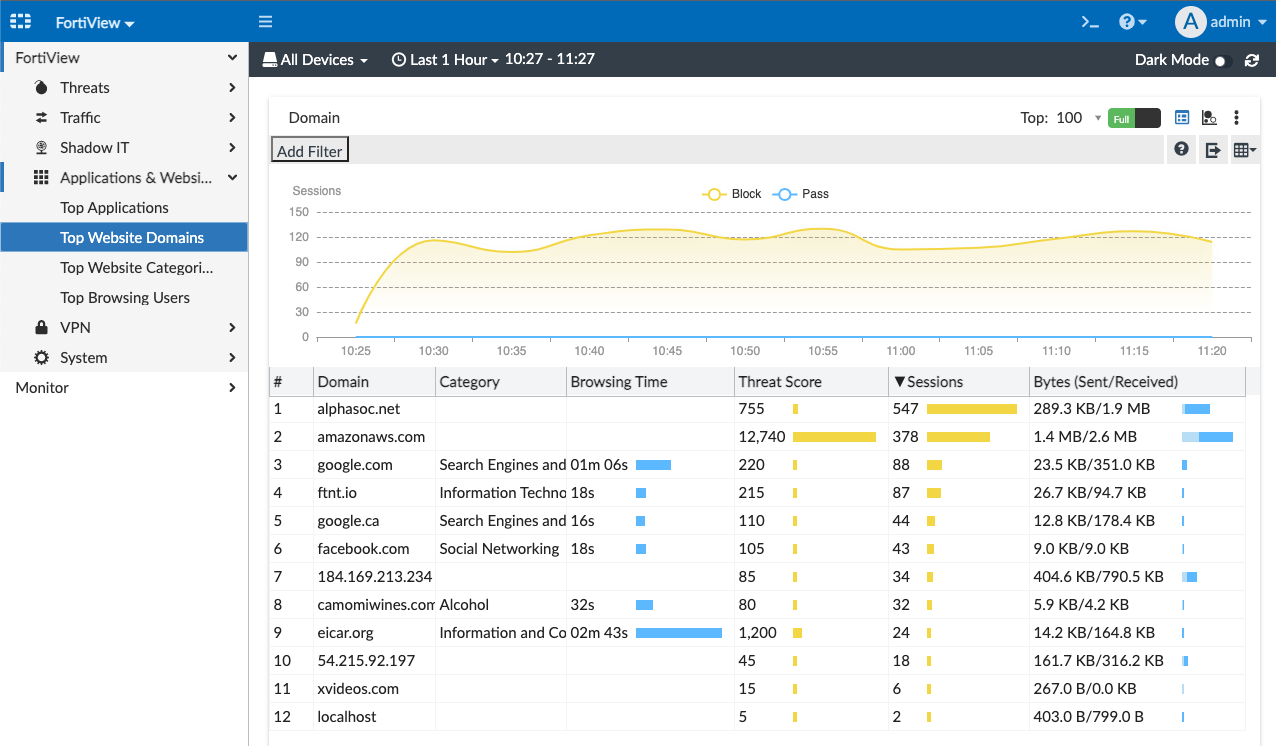
- Applications & Websites -> Top Website Domains
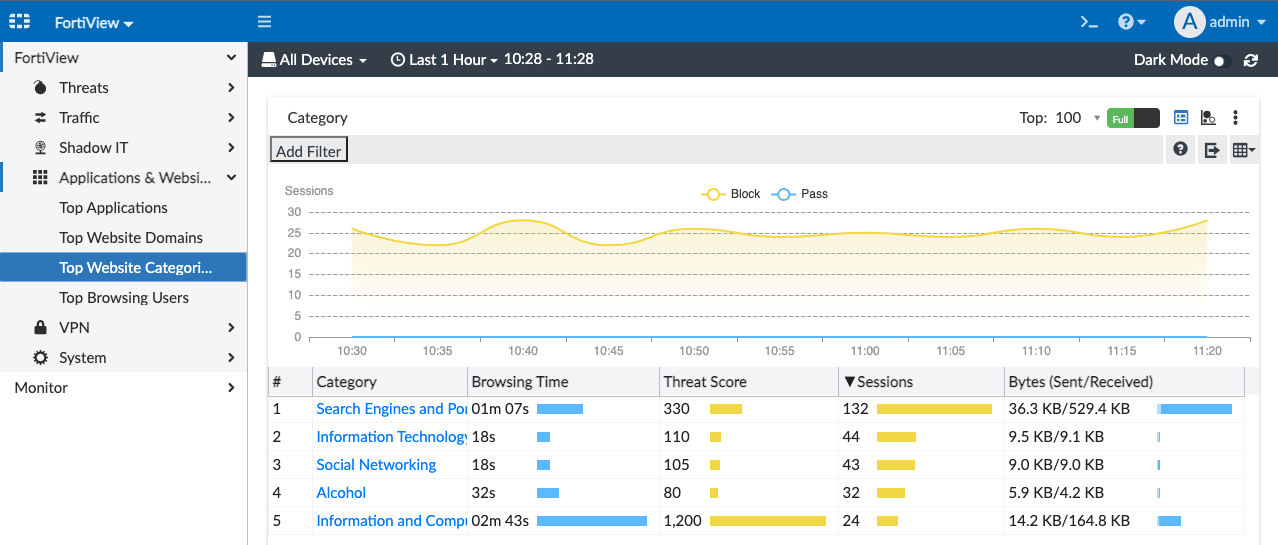
- Applications & Websites -> Top Categories
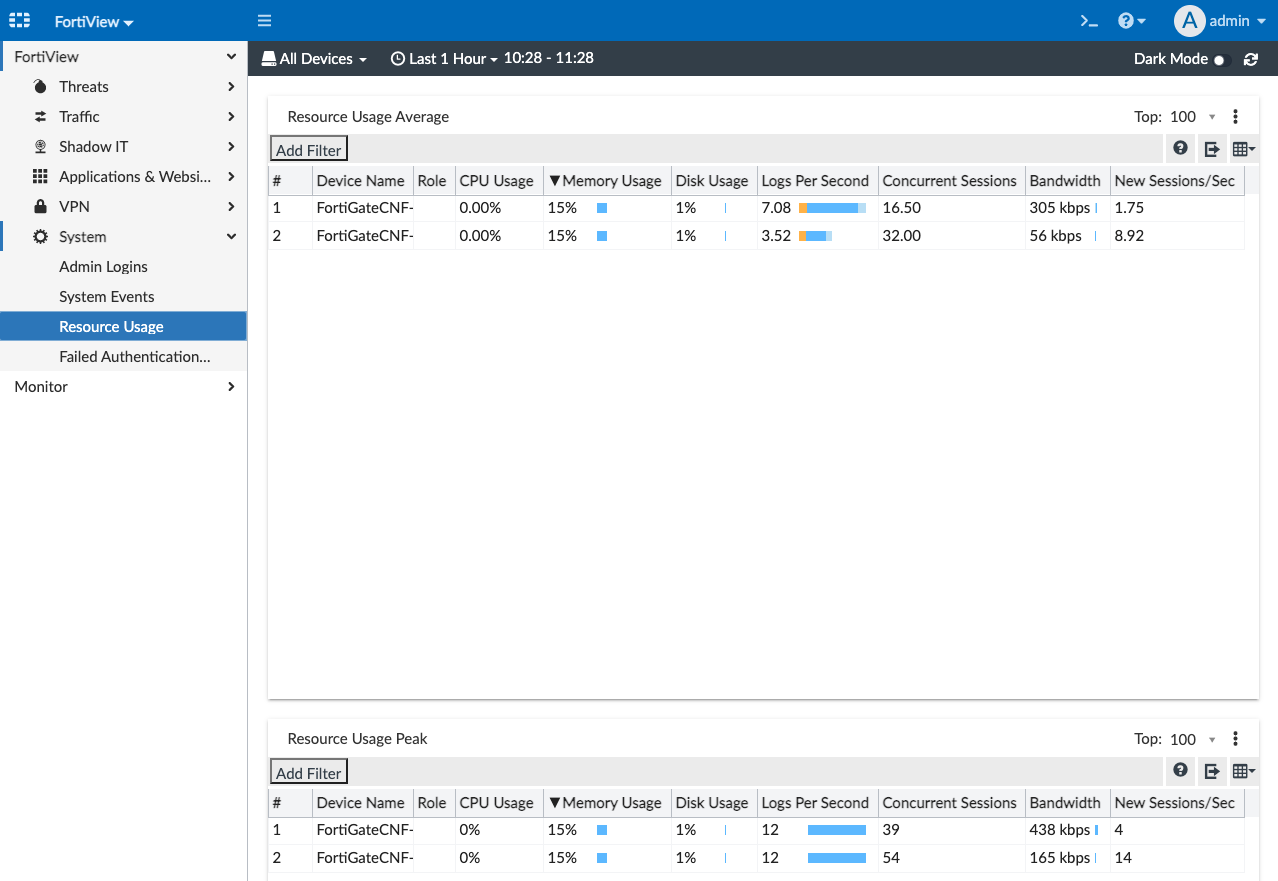
- System -> Resource Usage
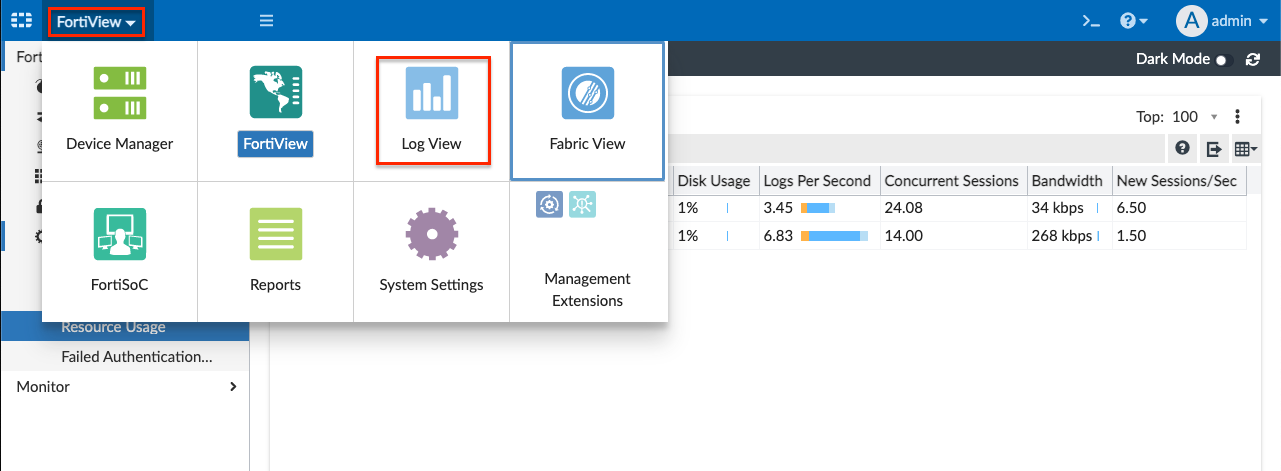
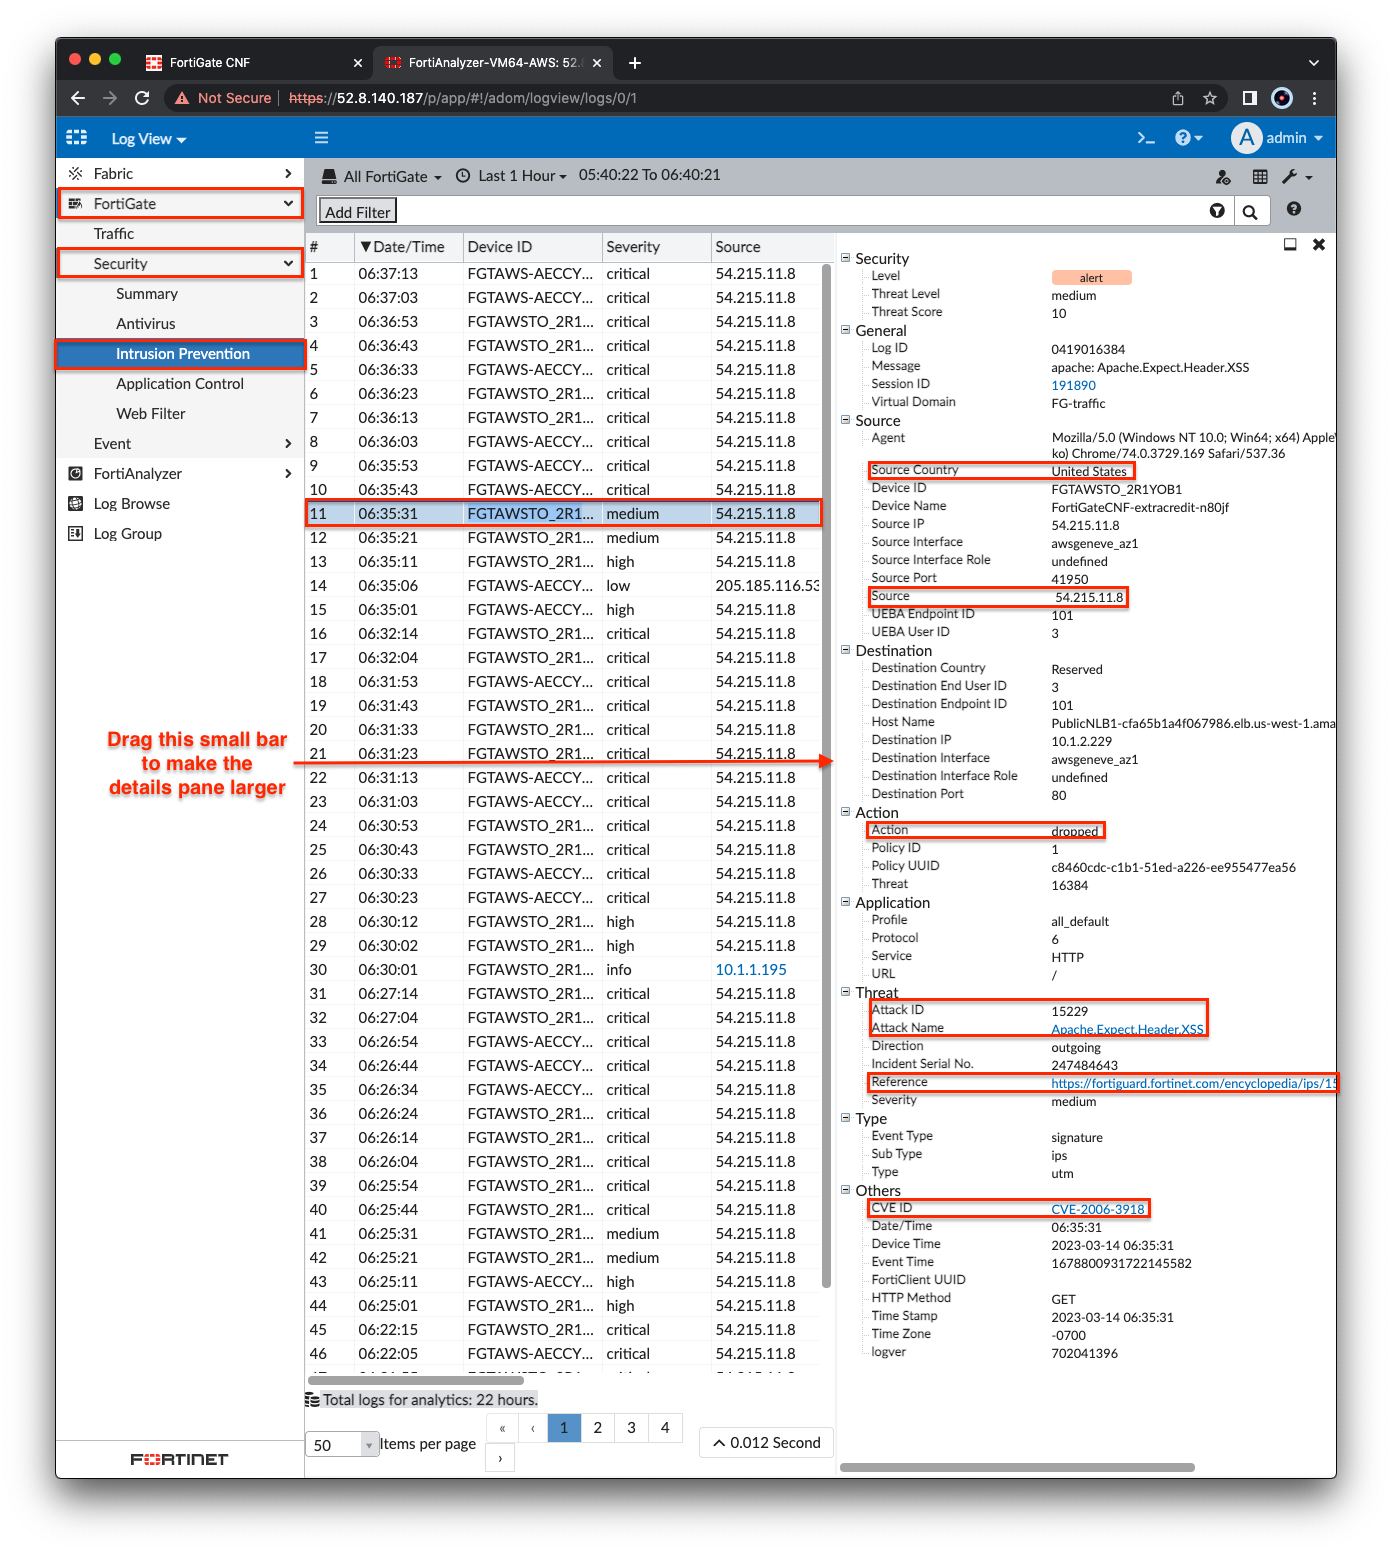
- In the top left, click FortiView then click Log View then select FortiGate -> Security -> Intrusion Prevention. Double click any log entry to view the log details.
- This concludes this section.
