Fortinet FortiWeb ZTNA and FortiSOAR Workshop

Fortinet FortiWeb ZTNA and FortiSOAR Workshop on Azure

In this workshop you will learn how to configure ZTNA on Fortinet’s FortiWeb Web application and API protection firewall. Also in the second part of the lab you will learn how we can use FortiSOAR to quarantine a client sending malicious traffic.

About TEC Workshops

TEC Workshops provide the learner with the opportunity to put into practice newly developed skills in an easy to launch environment that can be used for customer engagements. At a minimum a TEC Workshop will include the following:

  • A use case description

  • An integrated lab and demo environment

    • Informational call-outs for key points to discuss or highlight to a customer
    • Questions that could be asked while giving the TEC Workshop as a demo
    • Points of value that relate the business value to the technical feature
  • A reference architecture(s)

Optional components may be included for certain use cases

The TEC Workshop will not be a completely, self-contained learning experience for a single product. A TEC Workshop will cover features and often multiple products where they relate to the use case of interest.

Deployments will be automated for those tasks that are not salient to the learning or demonstration activity in the use case. For example, for a TEC Workshop focused on Indicators of Compromise, the system may deploy a FortiGate and FortiAnalyzer with configurations for these systems. However, the leaner will have to configure the Event Handlers for IOC setup.

FortiWeb ZTNA TEC Workshop

Introduction:

With increase in remote workforce and devices off networks, Security for accessing applications have been a challenge. ZTNA offers security for users that are not present on the network and are trying to access the applications and data. FortiWeb Web Application and API security firewall offers ZTNA with lot more other capabilities, protecting both north-south and east-west traffic. Fortiweb highlights include:

  • OWASP Top 10 protection signature database
  • Machine learning based Anomaly and Bot detection
  • ZTNA
  • API Schema protection
  • Machine learning based API learning

The purpose of this TEC Workshop is to familiarize the learner with FortiWeb ZTNA approach and architectural concepts specific to the Azure Cloud environment.

TEC Workshop Objectives
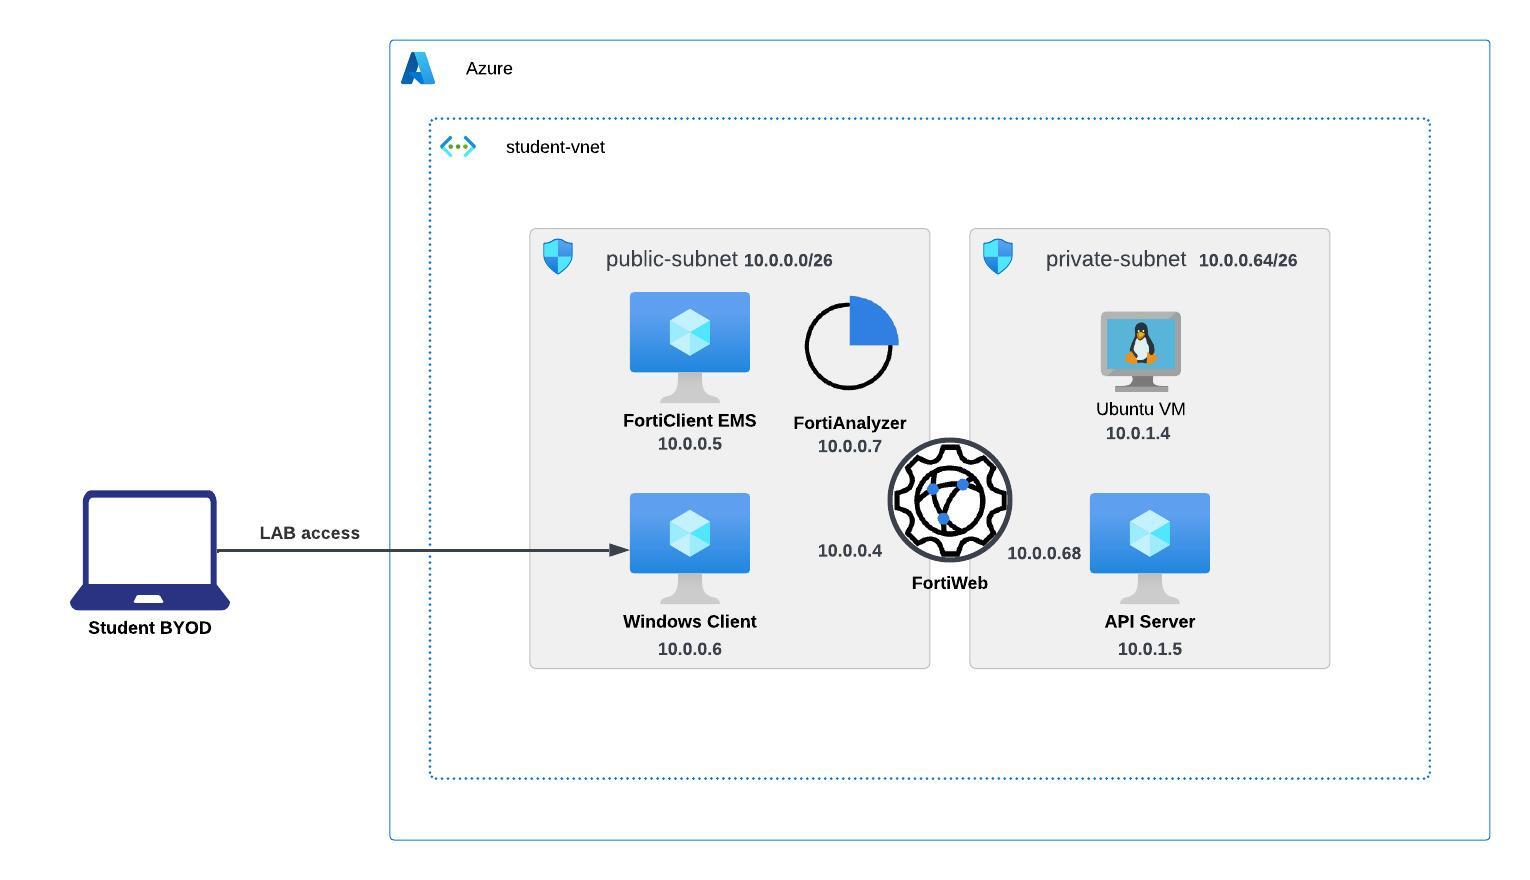
Lab-1:

  • Deploy the FortiWeb and all the required components like FortiEMS using Terraform
  • Configure EMS
  • Configure FortiWeb to provide access from Internet to Web application with ZTNA
  • Configure FortiWeb to provide access on a trusted network to access the web API

Lab-2:

  • FortiSOAR Access from FortiAnalyzer
  • Enable FAZ connector on FortiSOAR
  • Create a Playbook
  • Quarantine and UnQuaratine a client based on malicious traffic
Warning

The examples and sample code provided in this workshop are intended to be consumed as instructional content. These will help you understand how various Fortinet and Azure services can be architected to build a solution while demonstrating best practices along the way. These examples are not intended for use in production environments without full understanding of how they operate.

Version:
Last updated: Thu, May 22, 2025 21:53:35 UTC
Copyright© 2025 Fortinet, Inc. All rights reserved. Fortinet®, FortiGate®, FortiCare® and FortiGuard®, and certain other marks are registered trademarks of Fortinet, Inc., and other Fortinet names herein may also be registered and/or common law trademarks of Fortinet. All other product or company names may be trademarks of their respective owners. Performance and other metrics contained herein were attained in internal lab tests under ideal conditions, and actual performance and other results may vary. Network variables, different network environments and other conditions may affect performance results. Nothing herein represents any binding commitment by Fortinet, and Fortinet disclaims all warranties, whether express or implied, except to the extent Fortinet enters a binding written contract, signed by Fortinet’s General Counsel, with a purchaser that expressly warrants that the identified product will perform according to certain expressly-identified performance metrics and, in such event, only the specific performance metrics expressly identified in such binding written contract shall be binding on Fortinet. For absolute clarity, any such warranty will be limited to performance in the same ideal conditions as in Fortinet’s internal lab tests. Fortinet disclaims in full any covenants, representations, and guarantees pursuant hereto, whether express or implied. Fortinet reserves the right to change, modify, transfer, or otherwise revise this publication without notice, and the most current version of the publication shall be applicable.

Subsections of Fortinet FortiWeb ZTNA and FortiSOAR Workshop

Chapter 1 - Getting Started

Provisioning the Azure environment (40min)

Provision your Azure Environment, enter your Email address and click Provision

Warning

After submitting, this page will return with a blank email address box and no other indications. Provisioning can take several minutes. \*\*\* __PLEASE DO NOT SUBMIT MULTIPLE TIMES__ \*\*\*

When provisioning is complete, one of the following will happen.

  • You will receive an email with Azure environment credentials. Use those credentials for this environment, even if you have your own.
  • You will receive and email indicating that there are no environments available to utilize. In this case please try again at a later date.
  • You will receive an email indicating that the supplied email address is from an unsupported domain.
  • No email received due to an unexpected error. You can try again or notify the Azure CSE team.

Tasks

  • Setup Azure Cloud Shell
  • Run Terraform
  • Verify Terraform

Subsections of Chapter 1 - Getting Started

Task 1 - Setup Azure CloudShell

1. Setup your AzureCloud Shell

  • Login to Azure Cloud Portal https://portal.azure.com/ with the provided login/password

    cloudshell1 cloudshell1 cloudshell2 cloudshell2

  • Click the link “Skip for now (14 days until this is required)” do not click the “Next” button

    cloudshell3 cloudshell3

  • Click the “Next” button

    cloudshell4 cloudshell4

  • Click on Cloud Shell icon on the Top Right side of the portal

    cloudshell5 cloudshell5

  • Select Bash

    cloudshell6 cloudshell6

  • Click on Show advanced settings

    cloudshell7 cloudshell7

  • Select

    • Use existing Resource Group - it should auto populate with USERXX-workshop-sdwan (USERXX is your Username)
    • Use existing Storage account - it should auto populate with USERXX########## (########## is a random string)
    • Use existing File Share - type cloudshellshare
  • Click “Attach Storage”

    cloudshell8 cloudshell8

  • You should now have access to Azure Cloud Shell console

    cloudshell9 cloudshell9

Task 2 - Run Terraform

Task 2 - Launch resources using Terraform

All the components required for Lab1 and Lab2 are deployed through terraform.

Here is the Architecture diagram for Lab1:

lab1diagram lab1diagram

Perform the following steps in your Cloudshell console to create your environment.

  1. Clone the Github repo git clone https://github.com/FortinetCloudCSE/FortiWeb-Azure-ZTNA-FortiSoar
  2. Change directory to the cd FortiWeb-Azure-ZTNA-FortiSoar/terraform folder
  3. Run terraform init
git clone https://github.com/FortinetCloudCSE/FortiWeb-Azure-ZTNA-FortiSoar
cd FortiWeb-Azure-ZTNA-FortiSoar/terraform
terraform init

lab11 lab11

  1. Set the Terraform environment variables (check in dedicated the e-mail send to you by the organizers):

    1. export TF_VAR_fortiflex_api_user='<api_user_sent_in_email>'
    2. export TF_VAR_fortiflex_api_password='<api_password_sent_in_email>'
  2. Run terraform apply -var='username=UserXX' --auto-approve

    Your username can be found in the login email.
    Say your Azure account login is fweb11@ftntxxxxx.onmicrosoft.com, your username is fweb11

export TF_VAR_fortiflex_api_user='<api_user_sent_in_email>'
export TF_VAR_fortiflex_api_password='<api_password_sent_in_email>'
terraform apply  -var='username=UserXX' --auto-approve

lab12 lab12

  1. Terraform deployment takes atleast 25-30 min to complete. Please copy the output once the deployment is succeeded.

lab13 lab13

Chapter 2 - Basic Setup

Basic Setup

  1. Licensing EMS
  2. Licening FortiWeb
  3. Create a Fabric Connector on FortiWeb for EMS
  4. Create ZTNA tags on EMS

Subsections of Chapter 2 - Basic Setup

Task 1 - EMS Setup

1. EMS Setup and licensing

  1. RDP to the EMS Server IP address (Terraform output) using the all_username and all_password credentials.

    windowsserver1 windowsserver1

  2. FortiEMS is already installed on Windows Server.

    FortiEMS FortiEMS

  3. Double-Click to open FortiEMS. On the first login, username is admin/password is blank. Click Signin.

    FortiEMSlogin FortiEMSlogin

  4. We need to Set up new password here. Please note this password as we will use this to sign in to EMS.

    FortiEMSPassword FortiEMSPassword

  5. The FortiEMS is not licensed. We need to upload the BYOL license. License is already provided through email for the Cloud CSE team. If license is not provided you can ITF the FortiEMS license with SKU: FC1-10-EMS04-429-01-12.

    FortiEMSDashboard FortiEMSDashboard

  6. To activate the license, copy the hardware ID from EMS System » Dashoboard » Status.

    FortiEMSlicense FortiEMSlicense

  7. Login to https://support.fortinet.com, register asset with the hardware ID. Download the license document.

    1. Paste the registration code from the license document, click Next
    2. Paste the Hardware ID from the EMS » register

    FortiEMSlicense FortiEMSlicense

  8. On EMS Dashboard » Status - login with the FortiCloud Account the license is registered.

    FortiEMSlicensesync FortiEMSlicensesync

2. Updating License

  1. On EMS, we see “SSL Certificate is not Secure” at the top.

    FortiEMScert FortiEMScert

  2. To upload a certificate to EMS, Navigate to System Settings » EMS Server Certifcates » Add. on Upload PKCS12 tab, browse to find certificate from the Dekstop.

    FortiEMSupload FortiEMSupload

  3. on the Desktop, there is a folder called ems_ssl_certificates » upload EMS_Demo_Server certificate. Password for the certifiactae is password (all lower case)

    FortiEMSpem FortiEMSpem

  4. In System Settings » EMS settings, for WebServer certificate select the newly uploaded certificate and also enable “use webserver cert for end point control” , click Save.

    FortiEMSsettings FortiEMSsettings

  5. On EMS » In Endpoint Policy and components » CA Certificates » Upload the CA Certificate from the ems_ssl_certificates folder on the Desktop.

    FortiEMSsettings FortiEMSsettings

  6. Now you should see that the EMS Certificate is SSL secure at the top.

    FortiEMSsecure FortiEMSsecure

Task 2 - FortiWeb Setup

Licensing FortiWeb

  1. Login to FortiWeb with https://<fortiweb_pip>:8443. Fortiweb_pip IP can be found from Terraform output. Use the all_unsername and all_password as login credentials.

fortiweblogin fortiweblogin

  1. For licensing FortiWeb, please check your email. License is already provided. After uploading the the FortiWeb will reboot.

fortiweblicense fortiweblicense

Its a good idea to get some coffee while it is rebooting ;)

  1. After FortiWeb is back up, in System » Config » Feature visibility, enable ZTNA and Firewall features.

fortiwebfeature fortiwebfeature

Task 3 - Connect FortiWeb to EMS

Connect FortiWeb to EMS

  1. To connect FortiWeb to EMS, go to Security Fabric » Fabric Connectors » FortiClient EMS

    fortiwebems fortiwebems

  2. Enter the IP and Port for FortiWeb to connect to FortiClient EMS, click OK.

    fortiwebemsconnect fortiwebemsconnect

  3. You will see a Certificate warning to connect to EMS. Click OK.

    fortiwebemscert fortiwebemscert

  4. Login to FortiClient EMS, in Administration » Fabric Device » Authorize the FortiWeb.

    emsauthorize emsauthorize

  5. Once Authorized we should see that the connection is up on FortiWeb.

    fortiwebemsup fortiwebemsup

Task 4 - ZTNA tags creation

Creating ZTNA tags on FortiEMS

We need to create ZTNA tags to tag endpoints that connect to FortiClient. These tags will sync with FortiWeb and can be used in ZTNA rules.

  1. To create tags, on FortiClient EMS navigate to Zero Trust Tags » Zero Trust Tagging rule » Add.

    emstags emstags

  2. Enter name: windowsclient, tag endpoint as: windows (Press Enter for creating a new tag), click Add rule

    emswin emswin

  3. In the rule, Select Windows, in OS type: Windows, add the Windows version as shown below.

    emswindows emswindows

  4. Repeat Same steps for Linux.

    emslinux emslinux

  5. Also Create another tag for windows vulnerbale device as show below.

    emswinvulnerable emswinvulnerable

  6. By default we cannot see ZTNA tags when Endpoints connect to Zero Trust telemetry. For ZTNA tags to be visible on FortiClient, you need to enable in FortiEMS.

On FortiEMS » Endpoint profiles » System Settings » Advanced » enable show zero trust tag on FortiClient GUI. ztnatagsems ztnatagsems

Chapter 3 - ZTNA North-South

North-South ZTNA traffic

  1. Set up FortiWeb Policy
  2. Set up ZTNA policy on FortiWeb
  3. Test ZTNA North-South access.

Subsections of Chapter 3 - ZTNA North-South

Task 1 - FortiWeb Policy setup

FortiWeb Policy setup

  1. Before creating ZTNA profiles and Tags, We need to create a Server policy on FortiWeb. To create a server policy set up a server pool on FortiWeb.

    In Server Objects » Server Pool » Create new » Enter as shown below » Click OK

    fwebztna02 fwebztna02

  2. Click Create New to create a new server in Server pool as below.

    fwebztna03 fwebztna03 fwebztna04 fwebztna04

  3. Now, Create a Virtual Server. Server Objects » Virtual Server » Create new » click OK

    fwebztna05 fwebztna05

Now we will create a Virtual Server to listen on Port1 IP address

fwebztna06 fwebztna06

fwebztna07 fwebztna07

  1. Create a certificate in Server Objects » Certificates » CA Group

    cert01 cert01

  2. Create New CA group for FCTEMS and click OK.

    cert02 cert02

  3. Select Type CA, Select CA for FCTEMSXXXXXXX certificate as the CA, Click OK.

    cert03 cert03

    cert04 cert04

  4. Create a Server policy , in Policy » Server Policy » Create New as shown below.

fwebztna08 fwebztna08

  1. For Server pool, Virtual Server select the objects you created in Step 2 and 3. For HTTPS service select HTTPS

fwebztna09 fwebztna09

  1. Click Advanced SSL settings, For Certification verification for HTTPS click create new:

    cert05 cert05

  2. In the New Certificate Verify Tab, select the CA you have created earlier in Step 6. Finally Clik OK on the server policy.

    cert06 cert06

ZTNA Policies on FortiWeb

  1. Before setting up FortiWeb ZTNA rules, check if the ZTNA tags synced from FortiClient EMS to FortiWeb. On FortiWeb navigate to ZTNA » ZTNA profile » ZTNA tags. FortiWeb Might have to scroll to the end to see the tags created in earlier step.

    fwebztna fwebztna

  2. Create ZTNA rules to access the FortiWeb Web Server. Click OK.

    fwebztna101 fwebztna101

  3. Click on Add Condition, Select Type: ZTNA Tag, from Tag list Windows, Match condition: Any, click OK.

fwebztna11 fwebztna11

  1. In ZTNA profile, Create ZTNA profile with name WebServerAccess, Set Default action to Alert and Deny. Click OK.

    fwebztna12 fwebztna12

  2. For ZTNA Profile Member » Create new » Update to Add the rule you created in Step 9.

    fwebztna10 fwebztna10

    fwebztna14 fwebztna14

  3. Now go back to Server Policy » Policy » Edit the existing Policy.

    Scroll down to ZTNA profile and assign the profile created in previous step and click Save.

    fwebztna15 fwebztna15

Task 2 - Verify North-South Traffic

Test ZTNA North-South Inspection

  1. To Test N-S Access, RDP to Windows10 Client (windows_client_pip address is in Terraform Output)

  2. on Windows 10 VM, the FortiClient is already installed. Double click on FortiClient EMS, Click on Zero trust telemetry

    ztnatest01 ztnatest01

  3. In Zero Trust Telemtry » Input the IP of your Windows » Click Connect

    ztnatest02 ztnatest02

  4. Once the FCT is connected to EMS, you should see a Windows Tag assigned to FCT.

    ztnatest03 ztnatest03

  5. Open a browser on Windows Cliet and type https://10.0.0.4 in the browser or the Public IP address of FortiWeb the Port1 is NAT’d. Remember Virtual Server we created is listening on Port1 of the FortiWeb with IP 10.0.0.4.

ztnatest04 ztnatest04

ztnatest06 ztnatest06

  1. You can also check to get to the API documentation by typing https://10.0.0.4/docs

ztnatest05 ztnatest05

  1. Repeat the same step from your local machine. You should not be able to get to the FastAPI web page since you are not conencted to FCTEMS.

ztnatest07 ztnatest07

Chapter 4 - Microsegmentation

East-West ZTNA microsegmentation

  1. Setup E-W ZTNA microsegmentation.

Subsections of Chapter 4 - Microsegmentation

Task 1 - East-West ZTNA traffic

East-West inspection

  1. Now that Server policy is all setup, for microsegmentation within trusted network using ZTNA we need to edit the ZTNA profile. Also, since FortiWeb has a firewall we will be using a firewall policy to prevent traffic between trusted network.

  2. lets create a static route to get to the internal VNET through port2 in Network » Route » Static route.

staticroute staticroute

  1. Also Lets create a firewall policy. In System » Firewall » Firewall Policy » Firewall Service.

    1. Create a Service for ICMP service2 service2

    2. Create another service all, by leaving everything to default. service service

  2. To create a firewall policy , set the default action to “Accept” also create policies as shown below to deny the icmp traffic and also all Port1 to port2 traffic.

    firewall firewall

  3. SSH to the webserver_public_ip to register it to FortiEMS using the below command. forticlient_ems_server_public_ip can be found in Terraform output log.

    Once registered you should see the WebServer and APIServer on FortiEMS Endpoints module.

    forticlient epctrl register "<forticlient_ems_server_public_ip>"

    webserver webserver

  4. Now in ZTNA profile, update the already created ZTNA rule to add Linux tag.

    ztnaprofile ztnaprofile

  5. Linux VM is already connected to the EMS. You can check endpoints connected to EMS.

    endpoint endpoint

  6. Now SSH to the other trusted Linux VM (IP address is in Terraform output) to get to the API server. once logged in type the below command.

    curl --insecure https://10.0.0.4

    curl --insecure https://10.0.0.4/docs

You should see hello world response from the first command and also swagger html as a response from the /docs

helloworld helloworld

swagger swagger

  1. Now try the same to hit the trusted server directly.

    curl --insecure https://10.0.1.5

    curl --insecure https://10.0.1.5/docs

LAB - 2

Lab Architecture Diagram

This Diagram provides a high-level overview of the deployed Systems and the corresponding internal IP addresses. FortiSOAR is deployed as a Management Extension on FortiAnalyzer VM

labdiagram2 labdiagram2

Chapter 5 - FortiAnalyzer and FortiSOAR

Introduction

In this lab, we will begin by providing a brief introduction to FortiSOAR. FortiSOAR is a comprehensive Security Orchestration, Automation, and Response (SOAR) platform. It offers a centralized and integrated solution for managing security incidents, automating response actions, and streamlining security operations.

After familiarizing ourselves with FortiSOAR, we will proceed with a series of initial steps to get acquainted with the platform’s interface and functionalities. This will help you gain a better understanding of how FortiSOAR operates and how it can be utilized in real-world scenarios.

Once we have covered the foundational aspects of FortiSOAR, we will move on to the core focus of this lab: developing your own playbook to respond to an incident reported by FortiClient EMS.

By combining the knowledge and skills acquired from previous labs, specifically the Zero Trust Network Access (ZTNA) lab with FortiWeb, you will create a playbook tailored to react efficiently to the incident. This will involve integrating the insights gained from the ZTNA lab, where you explored the secure access capabilities of FortiWeb.

During the playbook development process, you will leverage FortiSOAR’s capabilities to automate response actions based on predefined conditions and triggers. These actions may include gathering additional information, analyzing the incident’s severity, identifying affected endpoints, and implementing appropriate remediation measures.

By the end of this lab, you will have hands-on experience in utilizing FortiSOAR’s features to create a customized playbook that combines the knowledge obtained from previous labs, particularly the ZTNA lab with FortiWeb. This exercise will help you understand the practical application of FortiSOAR in incident response and further enhance your proficiency in leveraging security automation tools.

Overview

This lab is built as an extension of the previous Lab (ZTNA with FortiWeb). Additionally, FortiAnalyzer & FortiSOAR will be introduced as tools to solve the upcoming task.

There is no need to apply any additional Setup steps as the infrastructure already got deployed at the beginning of the previous Lab.

As similar Scenario is show in the following video by the Product Manager of FortiSOAR. In this Video, Malicious traffic got detected from a specific Workstation. With the help of FortiSOAR and the ML Engine, the SOC analyst get provided with various quick actions and additional information which helps to Quarentine the Client and mitigate the issue within seconds.

Subsections of Chapter 5 - FortiAnalyzer and FortiSOAR

Task 1 - Preparation of FortiAnalyzer and FortiWeb

Prepare FortiAnalyzer and FortiWeb for the Lab

This Chapter includes necessary steps to setup Log shipping and Event Monitoring with FortiAnalyzer of FortiWeb. Please make sure you have completed this section before moving on!

FortiWeb Preparations

  1. Login to FortiWeb with the give credentials

image-20230709100007610 image-20230709100007610

  1. On the left sided menu, goto Log&Report - Log Policy - FortiAnalyzer Policy

image-20230709100136898 image-20230709100136898

  1. Select Create New at the top left to open the Configuration Wizard

image-20230709100218505 image-20230709100218505

  1. Provide a meaningful name for the Policy and the click OK to save

image-20230709100329362 image-20230709100329362

  1. After the Policy has been saved, click on Create New to a add a new entry to the policy
  2. Enter the IP Address of Fortianalyzer into the corresponding field, then click on OK to add the entry

image-20230709100501970 image-20230709100501970

  1. Check that the new entry was added successfully, click OK again to make sure that everything is saved.

image-20230709100708834 image-20230709100708834

  1. On the left sided menu, goto Log&Report - Log Config - Global Log Settings

image-20230709100817629 image-20230709100817629

  1. Enable FortiAnalyzer and select the previous configured FortiAnalyzer Policy

image-20230709100858606 image-20230709100858606

  1. Click on Apply at the bottom of the Page to save the configuration.

  2. To enable the global logging, open the built-in CLI by clicking on the >_ Symbol the to top right

image-20230709101052663 image-20230709101052663

  1. Execute the following commands
config log traffic-log
set status enable
end
  1. Logging of FortiWeb to FortiAnalyzer is now enabled. Please proceed with the configuration of FortiAnalyzer

FortiAnalyzer Preparations

  1. Login to FortiAnalyzer with the given Credentials

image-20230709101603138 image-20230709101603138

  1. Goto Device Manager and click on Add Device to add FortiWeb

imagesoar8 imagesoar8

  1. Provide the follwoing Information, then click on Next to proceed with the configuration.

    • Name: FortiWeb
    • Serial Number: (This can be found at the Dashboard of FortiWeb)

    imagesoar9 imagesoar9

    image-20230709102101586 image-20230709102101586

    1. Wait until the Device got added successfully. Then click on Finish to close the wizard.

    image-20230709102205239 image-20230709102205239

    1. To finalize the FortiWeb configuration, select the entry from the Device table and click on Edit

    image-20230709102329079 image-20230709102329079

    1. Update Admin User and Password with the given credentials, then click on OK to save.

    image-20230709102616262 image-20230709102616262

    1. To be able to feed Security Events within FortiSOAR, Events need to get generated within the Event Monitor. For this to work, a so called Handler needs to be in Place. The Handler for FortiWeb is disabled by default and needs to be enabled. For this, goto Incidents & Events - Handlers

    image-20230709102903218 image-20230709102903218

    1. Select the Basic Handlers Tab, then use the Search field at the top right to search for FWB

    image-20230709103021477 image-20230709103021477

    1. Right click on the search result, click on Enable to activate the handler.

    image-20230709103116772 image-20230709103116772

    1. Check that the Status changes from disabled to enabled (green checkmark)

    image-20230709103200793 image-20230709103200793

    1. As soon as FortiWeb detects an attack, a new Event entry will get added. See the following Example:

    image-20230709103500888 image-20230709103500888

    Please make sure, that a Web Protection Profile is used within the configured FortiWeb Policy. The default policies provided by FortiWeb are more than enough with regards to this lab.

    image-20230709103720408 image-20230709103720408

  2. Congratulations, you are done with the preparations. Please continue to the next Section of the Lab.

Chapter 6 - FortiSOAR Overview

  1. Introduction to FortiSOAR
  2. FortiSOAR Content Hub & Connectors

Subsections of Chapter 6 - FortiSOAR Overview

Task 1 - Introduction to FortiSOAR

How to Connect to FortiSOAR Webinterface

  1. Open the URL of FortiAnalyzer, using the Public IP Address (e.g. https://20.234.157.6)
  2. Login into FortiAnalyzer with the provided lab credentials

image-20230703161312434 image-20230703161312434

  1. In the FortiAnalyzer Setup Wizard, click on Next, then keep the default hostname and click on Nextagain.

image-20230703161503446 image-20230703161503446

  1. Click on Finish to complete the Setup

image-20230703161536512 image-20230703161536512

  1. At the left side menu, select Management Extension

image-20230703161621934 image-20230703161621934

  1. if not automatically selected, click on FortiSOAR to access the FortiSOAR Webinterface. In Case not already done, accept the Terms and Service by Scrolling down to the Bottom of the embedded Site and click on Accept

image-20230703172719810 image-20230703172719810

  1. The FortiSOAR Dashboard Page should be now visible as a iframe

image-20230703161816336 image-20230703161816336

  1. Congratulations, you have successfully logged into FortiSOAR. Proceed with the next Chapter.

Install Licenses into FortiSOAR

By default, FortiSOAR comes with a limited Perpetual license. This type of license provides you with a free trial license an unlimited time for FortiSOAR, but in a limited context, i.e., with restrictions on the number of users and actions that can be performed in FortiSOAR in a day. By default, this license is an “Enterprise” type license and is restricted to 2 users using FortiSOAR for a maximum of 300 actions a day.

  1. Within the FortiSOAR WebUI, select the Gear icon at the top right.

imagesoar1 imagesoar1

  1. In the System Configuration, goto the License manager

imagesoar2 imagesoar2

  1. Copy the Device UUID and enter into the Support Portal to be able to Download the licenses file.

imagesoar3 imagesoar3

  1. Upload the license file via Update License
  2. Drag’n Drop / Select the license file, then click on Install License File

image-20230704140808211 image-20230704140808211

image-20230704172742780 image-20230704172742780

  1. Confirm the Installation of the new license

image-20230704172816380 image-20230704172816380

If you recive an error like below, wait some minutes and repeat the step

image-20230704172938917 image-20230704172938917

  1. Validate that the new license has been installed correctly

image-20230704174302655 image-20230704174302655

Incident and Alarm Handling in FortiSOAR

Incident and alarm handling are crucial components of any security operation. When security incidents occur or alarms are triggered, it is essential to have a systematic and efficient approach to address them. FortiSOAR provides a centralized platform to manage and handle incidents and alarms effectively.

With FortiSOAR, security incidents and alarms from different security devices and systems, such as FortiWeb and FortiClient EMS, can be consolidated and correlated in a single dashboard. This consolidation allows security teams to gain a comprehensive view of the security landscape, enabling faster and more accurate incident response.

FortiSOAR automates the initial triage and categorization of incidents and alarms, reducing the manual effort required. It applies predefined playbooks or workflows to incidents based on their severity, type, or other criteria. Playbooks consist of a series of automated actions, such as gathering additional information, enrichment, containment, and remediation. By automating these repetitive and time-consuming tasks, FortiSOAR enables security teams to focus on more critical and strategic activities.

More Information can be found in the FortiSOAR User Guide - Working with Modules - Alerts & Incidents

How to access the Alarms & Incident section

  1. Expand the sidebar menu by clicking on the arrow the at top left

image-20230703165828637 image-20230703165828637

  1. Select Incident Response - Alerts to access the recived alerts and events

image-20230703165927793 image-20230703165927793

This Section is empty at the moment. The further we get in the lab, the more alerts there will show up.

  1. The Incidents can be found in the same menu right after the Alerts

image-20230703170242741 image-20230703170242741

Incidents are usually a group of multiple events and can contain multiple Alerts and Indicators.

Task 2 - FortiSOAR Content Hub

FortiSOAR Content Hub & Connectors

Content Hub is a vital component of FortiSOAR that provides a centralized repository of pre-built playbooks, scripts, and integrations. It serves as a knowledge base and resource center for security operations, allowing teams to leverage existing content and collaborate effectively.

Content Hub offers a vast collection of pre-defined playbooks created by Fortinet’s experts and the broader cybersecurity community. These playbooks cover a wide range of use cases, including incident response, threat hunting, vulnerability management, and compliance. By utilizing these pre-built playbooks, security teams can accelerate their response times and ensure consistency in their incident handling processes.

In addition to playbooks, Content Hub provides access to a variety of integration connectors. These connectors allow FortiSOAR to connect and interact with different security tools, such as FortiWeb and FortiClient EMS, as well as third-party solutions. This seamless integration capability ensures that incidents and alarms from various sources can be ingested, analyzed, and responded to from a single platform.

Furthermore, Content Hub enables collaboration and knowledge sharing among security professionals. It allows users to contribute their playbooks, scripts, and integrations to the community, fostering a vibrant ecosystem of security automation. This collaborative approach encourages the exchange of best practices and empowers security teams to continually improve their incident response capabilities.

More Information can be found in the FortiSOAR User Guide - Content Hub

How to access the Content Hub

  1. If not already done, expand the sidebar menu by clicking on the arrow the at top left image-20230703165828637 image-20230703165828637

  2. Select Content Hub to access the recived alerts and events image-20230703171703304 image-20230703171703304

  3. A whole new view gets populated. This allows to search and filter for various Connectors, Solution Packs and Widgets to advance FortiSOAR image-20230703172016548 image-20230703172016548

The same information can be also found at the FortiSOAR Content Hub Webpage

Install FortiAnalyzer Connector

  1. Search for FortiAnalyzer in the Searchbar image-20230703172215245 image-20230703172215245

  2. Select the Fortinet FortiAnalyzer Connector. A new overlay Window appear which provides more details and the ability to install the connector. image-20230703173030364 image-20230703173030364

  3. To Install the selected Connector, click on Install at the bottom left of the Popup.

  4. To start the Installation, click on Confirm image-20230703173355701 image-20230703173355701

  5. Wait until the Connector Installation has been completed image-20230703173455643 image-20230703173455643

  6. After the successfull Installation, it will automatically return back to the Connector Popup which provides now additional configuration fields image-20230703174209489 image-20230703174209489

  7. Add a new configuration with the information show on the screenshot. Adjust the values to fit the information provided for the lab.

image-20230703175746414 image-20230703175746414 Note: Please uncheck the Verify SSL option as the lab is using a self signed certificate.

  1. Click on Save and validate that all Steps of the configuration verification, including the Health check are successfull. image-20230703175926590 image-20230703175926590

  2. Close the Configuration Popup.

  3. The Installed Connector can be viewed in at the Manage Tab image-20230703180909705 image-20230703180909705

Setup FortiAnalyzer Data Ingestion

Connectors in FortiSOAR can be used to tak action or to ingest Data into FortiSOAR like Assets, Events or Indicators, etc. Some Connectors, for example the FortiAnalyzer Connector allow to Ingest Data & take actions like Run Report, LIST LOG FIELDS, etc. These actions can be used within a playbook to “do something”. We will have a closer Look into Playbooks and how Connectors can be used in the next Chapter.

  • To view the predefined actions of a Connector, select the Actions & Playbooks Tab after you have selected a Connector image-20230704123319431 image-20230704123319431

To Configure the Data Ingestion of FortiAnalyzer, for example to feed Events generated by FortiClient EMS into FortiSOAR, take the following steps:

  1. In the FortiSOAR menu sidebar, goto Content Hub, select the ManageTab image-20230704124704695 image-20230704124704695

  2. In the Searchbar type FortiAnalyzer image-20230704124749201 image-20230704124749201

  3. Select the FortiAnalyzer Connector, and click on Configure Data Ingestion at the right side of the Window imagesoar4.jpg imagesoar4.jpg

  4. A new Overlay Popup will appear. Click on Let's start by fetching some data to start the configuration process image-20230704125148880 image-20230704125148880

  5. To configure field mappings with example data, adjust the default value as shown below and continue by clicking on FETCH DATA at the bottom right corner image-20230704125516762 image-20230704125516762

  6. keep the default field mappings and continue with the configuration by clicking on the button at the bottom right corner image-20230704133122563 image-20230704133122563

  7. In this lab, we will manually trigger the ingestion as the Lab is using an unlicensed version of FortiSOAR. This is limited to 300 Actions per day which also includes Data ingestion. In an production environment, a Schedule would be configured to automtically ingest the data and add the alerts to FortiSOAR. image-20230704133312839 image-20230704133312839

  8. Finish the configuration of the Data Ingestion by clicking on the Save Settings & Continue at the bottom right corner. image-20230704133628624 image-20230704133628624

  9. Click at OK at the bottom right of the screen to close the PopUp.

  10. Close the Connector configuration Wizard PopUp.

  11. To Manually ingest the Events, goto Automation - Data Ingestion at the left side Menu image-20230704133837765 image-20230704133837765

  12. An overview of all availibe Connectors wich allow Data Ingestion will appear. image-20230704133915122 image-20230704133915122

  13. By selecting the Fortinet FortiAnalyzer entry, an overview of the availible configurations will appear. Select Trigger Ingestion Now at the right to feed in availibe events and alerts. imagesoar5.jpg imagesoar5.jpg

  14. A banner at the top of the page will appear which confirms that the ingestion is running.

  15. To view the results, switch to the Incident Response - Alert Section and view the events getting added to FortiSOAR. image-20230704134318202 image-20230704134318202

image-20230704134544254 image-20230704134544254

Install FortiClient EMS Connector

  1. In the Content Hub menu, go back to the Discover Tab and search for FortiClient EMS image-20230703182044327 image-20230703182044327

  2. Select the Connector and install if not already done.

  3. Setup a new Configuration as shown below. Adjust the values to fit the information provided for the lab. image-20230703182857999 image-20230703182857999

  4. Click on Save and validate that all Steps of the configuration verification, including the Health check are successfull. image-20230703183009036 image-20230703183009036

Chapter 7 - FortiSOAR Playbooks

Introduction to FortiSOAR Playbooks

Playbooks play a pivotal role in security orchestration and automation, and FortiSOAR stands out by providing a comprehensive library of pre-built playbooks delivered by default. These playbooks, designed by Fortinet’s cybersecurity experts, offer a significant advantage compared to other competitors in the market.

The default playbooks provided by FortiSOAR serve as a robust foundation for organizations to establish efficient and effective incident response workflows. These playbooks cover a wide range of security scenarios, including malware detection and response, phishing incidents, network intrusions, and more. They encapsulate industry best practices and incorporate Fortinet’s extensive threat intelligence, ensuring that organizations have access to the latest and most effective incident response methodologies.

By leveraging these pre-built playbooks, security teams can significantly accelerate their incident response processes. Rather than starting from scratch, they can quickly customize and adapt the provided playbooks to align with their specific organizational requirements. This saves valuable time and resources, allowing security teams to respond promptly and effectively to security incidents.

More Information can be found in the FortiSOAR Playbooks Guide

Subsections of Chapter 7 - FortiSOAR Playbooks

Task 1 - Create your own Playbook

Playbook Editor

To start with the creation of a new Playbook, take the following Steps:

  1. Goto Automation - Playbooks

image-20230709104331292 image-20230709104331292

  1. Choose any Collection you want (for example 01 - Drafts Collection), then click on + Add Playbook imagesoar6 imagesoar6

  2. Provide a new Name for the Playbook, keep the default values and then click on Create

image-20230709104626775 image-20230709104626775

  1. The Playbook Editor is now open and ready to use.

Every Playbook has to start with the Trigger Step This could be e.g. Manual if you do not want to have it executed automatically or if e.g. the Playbook should get executed when a new Alert is created, choose the On Create Trigger.

For more information about the Trigger Step, please have a look at the FortiSOAR Playbook Development Guide

image-20230709104917793 image-20230709104917793

After selecting a Trigger, the Name and Execution Behaviour (Scope) needs to be defined. For Example, if the Playbook is used to reaction on an Alert, The Alerts Module would be selected. Multiple selections are possible if the Playbooks can be also used for other Modules.

In my case, I do not require any input to run, but the playbook should only be used in the Alerts Module. image-20230709115825816 image-20230709115825816

If done with the configuration of the Step, select Save at the bottom left of the Pop-up.

Now we have added our first Playbook Step - Good Job!

Before we will execute our Playbook to validate the functionality, change the Mode to DEBUG. This is important, as by default the INFO Mode only provides us if the Playbook run was successfull or not. This is to save space within the database and not filling it up with unneccessary details at runtime. While Development, we want to see which Variable and Step has which Output or Values assigned to make it easier in case of troubleshooting.

Within the Playbook Editor, click on INFO at the top right corner

image-20230709110007812 image-20230709110007812

Select DEBUG from the dropdown menu and click on Apply

image-20230709110036066 image-20230709110036066

To Execute a Playbook, click on the “Play”-Button the the top right of the Playbook Editor.

imagesoar7 imagesoar7

Don’t forget to regularly press Save Playbook button to not loose your work. This is also required, before executing a Playbook.

Let’s continue adding some Steps to our Playbook in the next Section.

Playbook Steps

To add a new Step, just “drag and drop any highlighted connecot points to add a new Step”.

image-20230709113830109 image-20230709113830109

At the left side, a new Pop-up appears which allows you to choose the type of the new Step.

image-20230709113928252 image-20230709113928252

Depending on what you want to do/achieve, select the Step. To specify a Variabl use the Set Variable Step from the Core Steps. If you want to trigger an action e.g. within FortiClient EMS or use any availabile activity from our FortiSOAR COnnectors, use the Connector Step from the Execute Section, and so on. Find more details about the different Steps and capabilities within the FortiSOAR Playbook Development Guide

I will first set a Variable as a next step. After selecting the Step Set Variable I have to choose a Name and then specify the variable name and it’s Content. As a Value, FortiSOAR allows to use Jinja2 Expressions and Filters.

To see some examples, select the Functions or Input/Output Tab after you have clicked into the Value field

image-20230709114723285 image-20230709114723285

image-20230709114739015 image-20230709114739015

In my case I do not have any value I want to reference to, so I will just add a String as value.

image-20230709114841278 image-20230709114841278

Save the step by clicking on the button at the bottom left.

Lets add another Set VariableStep which will access the previous added variable. For this, we need to provide a Name for the Step and a Name for the variable.

image-20230709115034233 image-20230709115034233

After clicking into the Value field, you will notive that the previous Variable appears on the right under the Input/OutputTab

image-20230709115446301 image-20230709115446301

By selecting the Custom Variable example the Jinja2 Expression will be automatically added as Value.

image-20230709115532177 image-20230709115532177

As an alternative, you can also write {{ vars. example }}

In case the next Step within a Playbook requires to use Values from a previous Step, FortiSOAR offers a very easy solution to access those. Just select the correlating Step within the Pop-up menu and follow the tree structur to select the required variable name. image-20230711132901386 image-20230711132901386

Click on Save to save our progress. Also don’t forget to save your Playbook.

The Playbook should look similar like the following:

image-20230709115942319 image-20230709115942319

Let’s run out created playbook. For this click on the “Play”-Button as described above. As no input is required, click on Execute at the bottom left.

image-20230709120103177 image-20230709120103177

The Execution Log will appear.

image-20230709120126657 image-20230709120126657

To debug the Playbook Steps, select the set variable Step. This allows to have a closer look what was the Input &Output of the Step.

image-20230709120258179 image-20230709120258179

Looking at the second Step, at the Input Tab you will see the Jinja2 Statement on how we accessed the Variable

image-20230709120351889 image-20230709120351889

And the Result can be viewed within the Output Tab

image-20230709120422485 image-20230709120422485

This was a very simple Playbook but for now this is everything you need to know to solve Challenge.

In the next Section, you will find some useful Jinja2 expression examples and Links which can be very handy.

If the Playbook ist done, you can use it e.g. within the Alerts Section. For this, just select an exiting alert and choose the Execute Menu entry at the top. The select the corresponding Playbook you want to execute. image-20230711122505908 image-20230711122505908

Jinja2 Filter and Functions

Fortinet provides a very comprehensive Guide which describes all Jinja2 Filters and functions in detail: FortiSOAR Jinja2 Filter & Functions

  • access variable example
{{ vars.example }}
  • access Step variable (List) output
{{ vars.example[0].value1 }}
  • For loop
{% for item in vars.example %} 
	{% if item == 'TEST' %}
	Yes  {% endif %}
{% endfor %}
  • If condition
{% if 1485561600000 > 1484092800000 %}
        {{vars.input.records[0]}} 
            {% elif 5==6 %}
        {{vars.input.records[0]}} 
{% endif %}
  • ipaddress Filter
{{ test_list | ipaddr }}

Chapter 8 - Challenges

You will be working on two challenges in this section.

  1. Quarantine client based on maclicious activity
  2. Unquarantine client

Subsections of Chapter 8 - Challenges

Task 1 - Quarantine Client

As a first Task in this lab, you will develop your own Playbook to quarantine Client on FortiClient EMS. Based on the Informaition you have learned in the Prvious Chapter, the Playbook has to accomplish the following tasks:

  • The Information of the Client need to be extracted based on a Security Event / Alert retrived from FortiAnalyzer/FortiWeb

    • To trigger an Attack alert, make sure that a Security profile is configured within the FortiWeb Policy, in addition, feel free to use the following string and just append it to the URL to trigger an Attack Alert
    ?q=%27%20or%20data%20@>%20%27{"a":"b"}%27%20--
  • Retrieve more details based on the Alert Information about the Client

  • Provide Approval Wizard before Quarantine Client with the following Information

    • FortiClient EMS ID
    • Client IP
    • Reason to Quarantine
    • OS Version
    • FortiClient Version
  • Quarantine Client on FortiClient EMS

  • Don’t forget to think about the case, that the Approval get’s rejected.

Hint

In case you will use the Get all Endpoints function of the FortiClient EMS Connector, the following Values are required:

  • Value for Field: Verifiction:
{
  "saml_id": "",
  "ldap_ids": []
}
  • Value for Field: Filter:
<Specify you filter here - have a look into the example playbook>

Task 2 - Unquarantine client

2 - Unquarantine Client

As the last Task, you have developed a Playbook which allows to quarantine a Client via FortiClient EMS. As you may notice, you have lost remote access to the Client. Your next Task is to develop a Second Playbook which will unquarantine the previous Client based in the same Input Values like in Task 1.

For this, the Playbook has to accomplish the following tasks:

  • Retrieve more details based on the Alert Information about the Client

  • Provide Approval Wizard before Quarantine Client with the following Information

    • FortiClient EMS ID
    • Client IP
    • Reason Client got Quarantined
    • OS Version
    • FortiClient Version
  • Unquarantine Client on FortiClient EMS

  • Don’t forget to think about the case, that the Approval get’s rejected.

Solution - Task 1

Challenge 1 Solution

In this Section you will find a detailed solution of the previos tasks. In addition, there are example Playbooks attached which you can import as a solution.

Example Playbook Overview

image-20230711133047657 image-20230711133047657

Step Details

  1. Stepname: Start

This is the Intitial Step. It is configured to start Manual and the Scope is defined to be only relevant for Alerts image-20230711154414015 image-20230711154414015

  1. Stepname: extract alert source data

FortiSOAR attaches by default the complete source data to every alert. This includes also non-visible information. As this Playbook extracts the Client IP address and for a better readablity, the source data will be extracted into it’s own variable. image-20230711154713835 image-20230711154713835

  1. Stepname: extract client details

Based on the source data of the alert, the client ip address and the alert subject would be relevant for further use. These get stored within their own variables. image-20230711154824343 image-20230711154824343

  1. Stepname: get all endpoints filtered

This step will use the FortiClient EMS Connector to retrieve all endpoints but with a filter based on the client ip address based on the information of the alert. image-20230711155330577 image-20230711155330577

image-20230711155401188 image-20230711155401188

  1. Stepname: approve quarantine

Before quarantine the client, a approval step based on the Manual Input Step is defined. This Step will output various details as requested by the Task and proceeds depending on the Button which is selected by the User. image-20230711155636573 image-20230711155636573

image-20230711155707879 image-20230711155707879

image-20230711155727082 image-20230711155727082

image-20230711155739757 image-20230711155739757

  1. Stepname: quarantine client

This step leverages the FortiClient EMS connector to quarantine the Client based on the client id which can be extracted of the result of step get all endpoints filtered image-20230711160123665 image-20230711160123665

  1. Stepname: cancel execution

This step is just an empty step which does nothing but ends the execution of the Playbook. image-20230711160033685 image-20230711160033685

Solution - Task 2

Challenge 2 Solution

In this Section you will find a detailed solution of the previos tasks. In addition, there are example Playbooks attached which you can import as a solution.

Example Playbook Overview

image-20230711135059383 image-20230711135059383

Step Details

  1. Stepname: Start

This is the Intitial Step. It is configured to start Manual and the Scope is defined to be only relevant for Alerts image-20230711154414015 image-20230711154414015

  1. Stepname: extract alert source data

FortiSOAR attaches by default the complete source data to every alert. This includes also non-visible information. As this Playbook extracts the Client IP address and for a better readablity, the source data will be extracted into it’s own variable. image-20230711154713835 image-20230711154713835

  1. Stepname: extract client details

Based on the source data of the alert, the client ip address and the alert subject would be relevant for further use. These get stored within their own variables. image-20230711154824343 image-20230711154824343

  1. Stepname: get all endpoints filtered

This step will use the FortiClient EMS Connector to retrieve all endpoints but with a filter based on the client ip address based on the information of the alert. image-20230711155330577 image-20230711155330577

image-20230711155401188 image-20230711155401188

  1. Stepname: approve quarantine

Before quarantine the client, a approval step based on the Manual Input Step is defined. This Step will output various details as requested by the Task and proceeds depending on the Button which is selected by the User. image-20230711155636573 image-20230711155636573

image-20230711155707879 image-20230711155707879

image-20230711155727082 image-20230711155727082

image-20230711155739757 image-20230711155739757

  1. Stepname: unquarantine client

This step leverages the FortiClient EMS connector to unquarantine the Client based on the client id which can be extracted of the result of step get all endpoints filtered image-20230711160506558 image-20230711160506558

  1. Stepname: cancel execution

This step is just an empty step which does nothing but ends the execution of the Playbook. image-20230711160033685 image-20230711160033685