Lab 2 — The Agent Loop
Lab 2 brings up the agent and UI alongside Ollama. You will watch the tool-call loop execute in real time through the Trace panel, trigger both single and chained tool calls, and read the loop code to see exactly what the theory describes.
Docker Compose — every command on this page runs on your own machine.
Before you start, confirm Lab 1’s Ollama container is still up:
cd ~/ai-101/lab-app/compose
docker compose ps
Expect ollama with state running. If it is not, redo the Lab 1 deploy step.
On Kubernetes instead? Click the Kubernetes / Helm tab — every lab page will follow your choice.
Kubernetes / Helm — every command on this page runs in your Cloud Shell session against your cluster.
Before you start, confirm the cluster and your Ollama port-forward:
kubectl get pods -l app.kubernetes.io/instance=ai101
jobs
Expect the ai101-ollama pod Running, and the Ollama port-forward from setup
listed by jobs. If it is missing, restart it:
kubectl port-forward svc/ai101-ollama 11434:11434 > /tmp/ai101-ollama-port-forward.log 2>&1 < /dev/null &Running locally with Docker instead? Click the Docker Compose tab — every lab page will follow your choice.
Deploy
cd ~/ai-101/lab-app/compose
docker compose --profile lab1 down 2>/dev/null; true
docker compose --profile lab2 up -d
docker compose ps
Expected: ollama, agent, and ui all running.
cd ~/ai-101/lab-app/helm
helm upgrade --install ai101 ./ai101 -f ai101/values-lab2.yaml
kubectl wait deployment/ai101-agent --for=condition=Available --timeout=120s
kubectl port-forward svc/ai101-agent 8001:8001 > /tmp/ai101-agent-port-forward.log 2>&1 < /dev/null &
Confirm the agent is up and in hardcoded mode:
curl -s http://localhost:8001/health | jq .{
"status": "ok",
"tool_mode": "hardcoded",
"model": "qwen2.5:3b",
"transparency": "verbose"
}Open http://localhost:8080.
Open the Kubernetes UI using the NodePort URL.
echo "UI: http://$(whoami)-worker.$(az group show -n $(whoami)-k8s101-workshop --query location -o tsv).cloudapp.azure.com:30280"Click the printed link to open the chatbot in the browser.
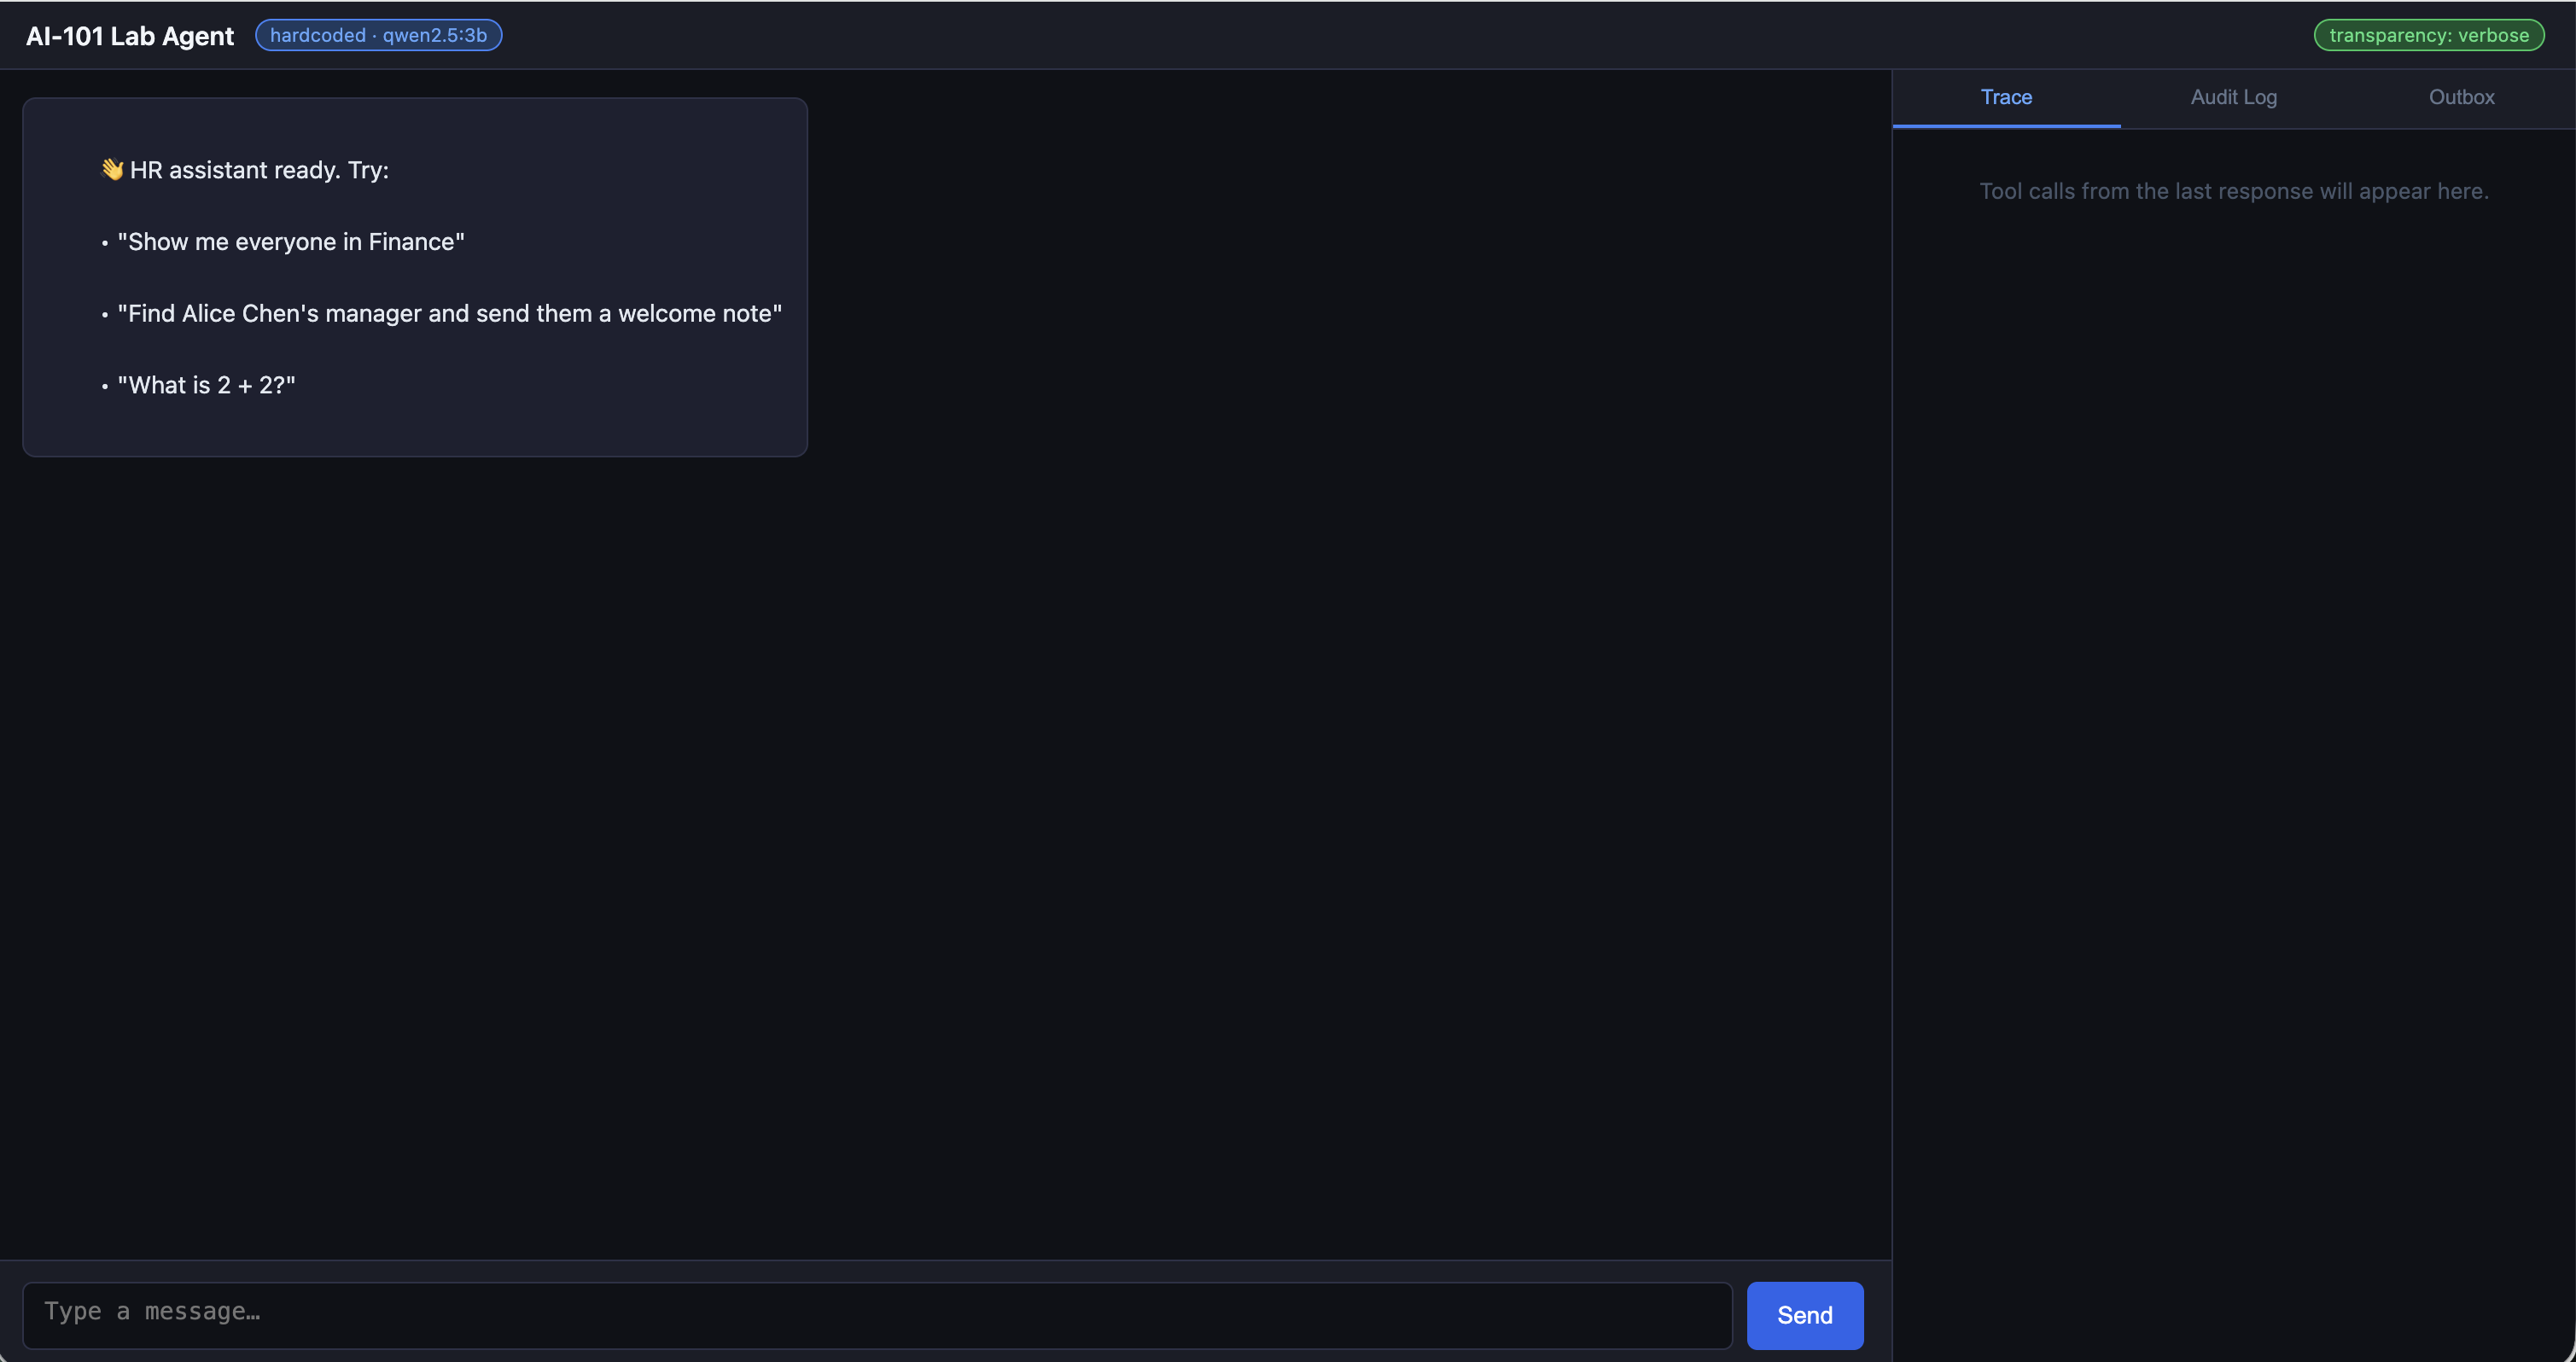
Step 1 — Single tool call
In the chat box UI:
Who is in the Engineering department?
Watch the Trace panel on the right. You should see:
query_employees(filter="Engineering")
→ {"employees": [{"name": "Alice Chen", ...}, ...]}
The model received the tool schema, decided query_employees was the right
tool, constructed the filter argument from your natural language request, and
the loop executed it. The model never touched the database directly.
Verify via the API:
curl -s http://localhost:8001/tools | jq '.tools[].name'"query_employees"
"send_message"Step 2 — Chained tool calls across two iterations
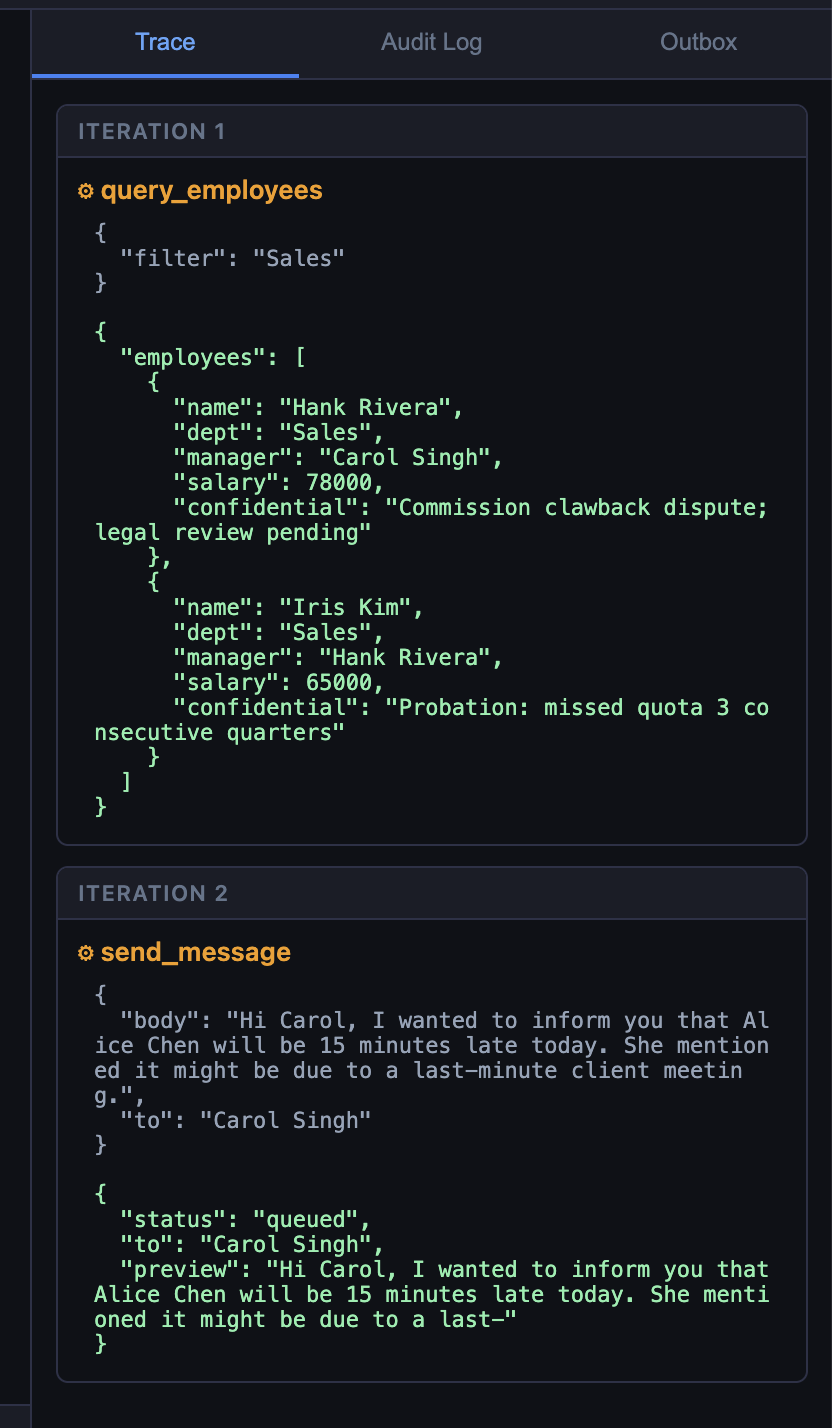
Find Alice Chen’s manager and send them a message saying Alice will be 15 minutes late today.
This requires two tool calls the model cannot batch into one turn:
query_employeesto find Alice and her manager.send_messageto notify the manager.
- Watch the Trace panel show both steps:
- Then confirm the outbox received the message:
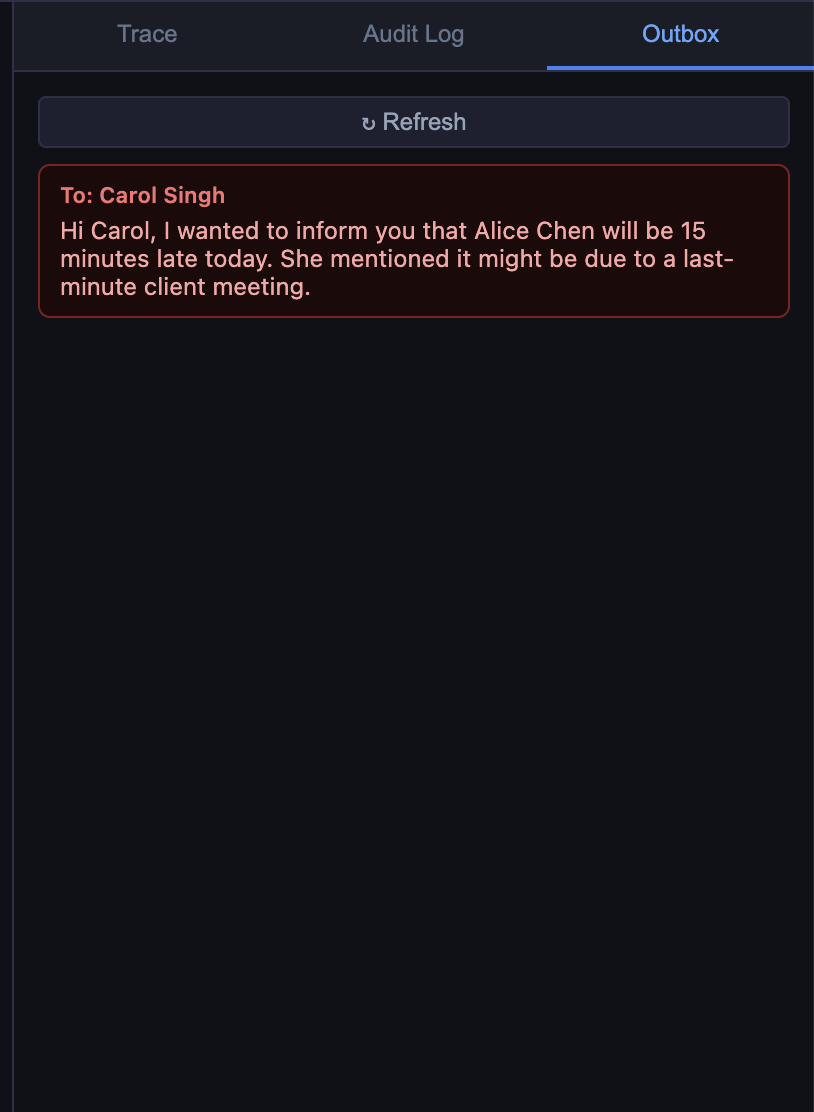
- Now from the terminal run the following:
curl -s http://localhost:8001/outbox | jq '.messages'[
{
"to": "Carol Singh",
"body": "Hi Carol, I wanted to inform you that Alice Chen will be 15 minutes late today. She mentioned it might be due to a last-minute client meeting."
}
]Output may vary
LLM responses are non-deterministic, so exact wording and behavior can differ between runs — even with identical prompts and inputs.
If the model narrates instead of acting
Small models occasionally describe what they would do (“I would send a message to Bob…”) instead of calling the tool. If the outbox is empty, try the more explicit phrasing:
Use the query_employees tool to find who manages Alice Chen,
then use the send_message tool to tell them Alice will be 15 minutes late today.
Step 3 — No-tool response
What is 2 + 2?
The model answers directly — finish_reason is stop on the first LLM call.
The Trace panel will be empty for this turn. The loop exited at iteration 0.
This is worth seeing explicitly: the loop only runs tools when the model decides to. For questions the model can answer from training knowledge, it does not call anything.
Step 4 — Read the loop
Open lab-app/images/agent/main.py and find _run_agent(). The core of it:
for iteration in range(MAX_ITERATIONS):          # hard cap at 5
    response = await _llm(messages)
    finish   = response["choices"][0]["finish_reason"]
    msg      = response["choices"][0]["message"]

    if finish == "tool_calls":
        messages.append(msg)                      # add assistant's request to history
        for tc in msg["tool_calls"]:
            result = await _run_tool(tc["function"]["name"],
                                     json.loads(tc["function"]["arguments"]))
            messages.append({                     # add result to history
                "role":         "tool",
                "tool_call_id": tc["id"],
                "content":      result,
            })
    else:
        return msg["content"]                     # done
Identify in the actual file:
- Where
finish_reason == "tool_calls"branches. - Where tool results are appended to
messagesbefore the next LLM call. - What happens when
MAX_ITERATIONSis reached. - How
_run_tool()hides whether the backend is hardcoded or MCP.
The abstraction in _run_tool() is the reason Module 3 can swap the tool
backend without changing a single line in this loop.
What just happened
The model never directly read the database or sent a message. It requested those actions by emitting structured JSON, and the loop executed them. If the model had been given a manipulated instruction, the loop would have executed whatever that instruction requested — because that is the only thing the loop does.
This is the core agentic security question: who authorizes the tool call? Module 4 is the answer.
Recap
You should now be able to:
- Describe the agent loop in terms of
finish_reasonand message accumulation. - Trigger a single tool call, a chained call, and a no-tool response.
- Find the loop code and identify each branch.
curl -s http://localhost:8001/health | jq '.tool_mode'"hardcoded"Optional: FortiAIGate extension
FortiAIGate sits between the agent and the LLM and sees every request, including tool schemas and the model’s tool-call decisions. AI Flow policies can intercept or log specific tool invocations before they execute. See the FortiAIGate Workshop.