Task 3 - Browser Based Developer Tools
| Goal | Learn to use Browser based developer tools |
| Task | We will enable Firefox’ Developer tools and use them to inspect the content returned by our simple flask application |
| Verify task completion | You will be able to see detailed information about the application’s content |
For this exercise, we will take a high level look at the Web Developer tool in Firefox. For more information about this tool, you can go to the Firefox DevTools User Docs.
Almost all browsers have developer toolkits. Below are some notable examples:
Open Firefox and Developer Tools
- Go to your Kali Linux RDP session
- Open Firefox from the top left menu bar and navigate to
http://localhost:8000/ - Right click anywhere on the screen, which will cause a menu to pop up. At the bottom of that menu, click on Inspect(Q)
- This will cause “Web Developer Tools” to open at the bottom of the screen.
Dig a bit deeper
Inspector
The inspector tab shows the HTML used to render this page. Take a look at the code and expand some of the menus.
Scroll down and right-click on the link “To hear what other have to say”. Select Inspect(Q). This will highlight the code associated with this line.
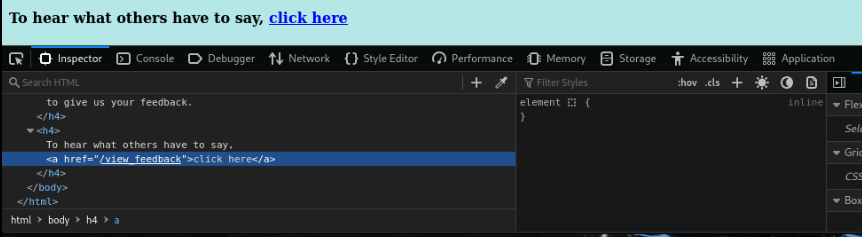
We can see that this is a href (hypertext reference). this tells us the source of the file used in this tag.
Open your terminal and input:
more simple_flask_auth/templates/view_feedback.html
You should see something like:
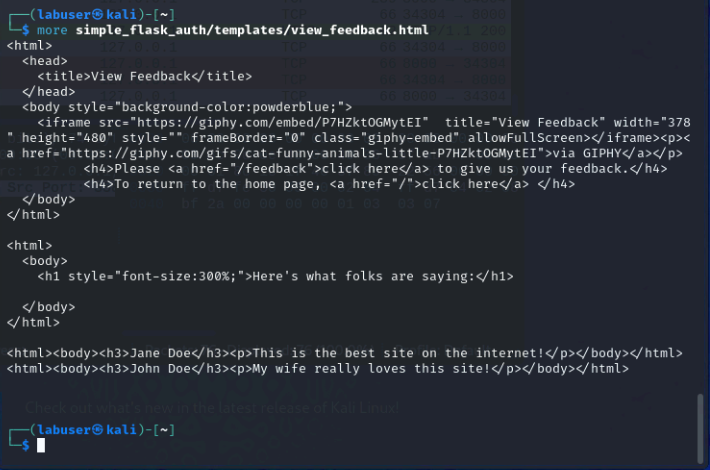
Now, left-click on the link to go to the page. Compare the html to the outputs on the rendered page.
Network Inspector
The network tab gives us a lot of information about traffic to and from the application itself. This can be quite useful for viewing how the application is actually operating at layer 7.
Click on The “Network” tab in the Web Developer Tool section at the bottom of the page.
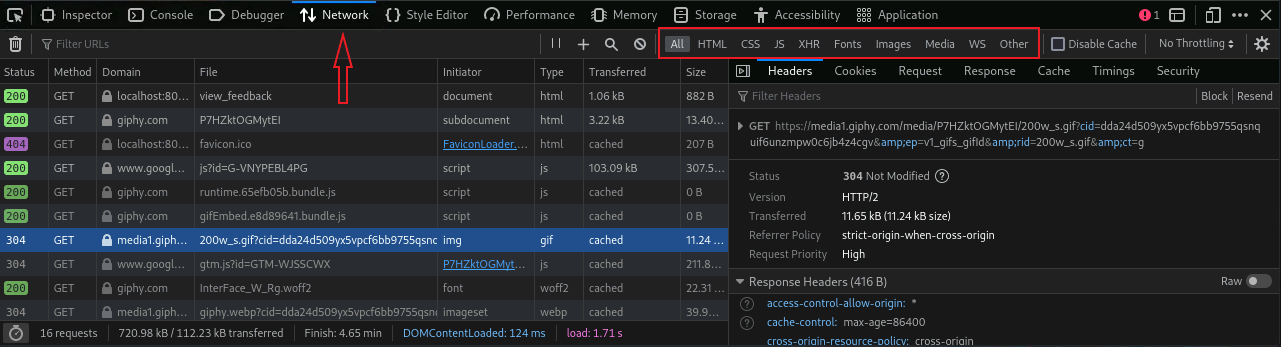
At a glance, we can see the HTTP status code, method and domain.
- Notice here that much of the network traffic displayed is not from “localhost”. As we can see a lot of the traffic is from, or related to giphy.com. This is due to the embedded link, which ultimately renders the fun Kitty GIF.
By default, All option is selected. The other options to the right, are high level category filters.
- Select the Images filter.
- In the “Filter URLs” bar, type giphy
- Hover over the “File” section of one of the “media1.giphy.com” lines.
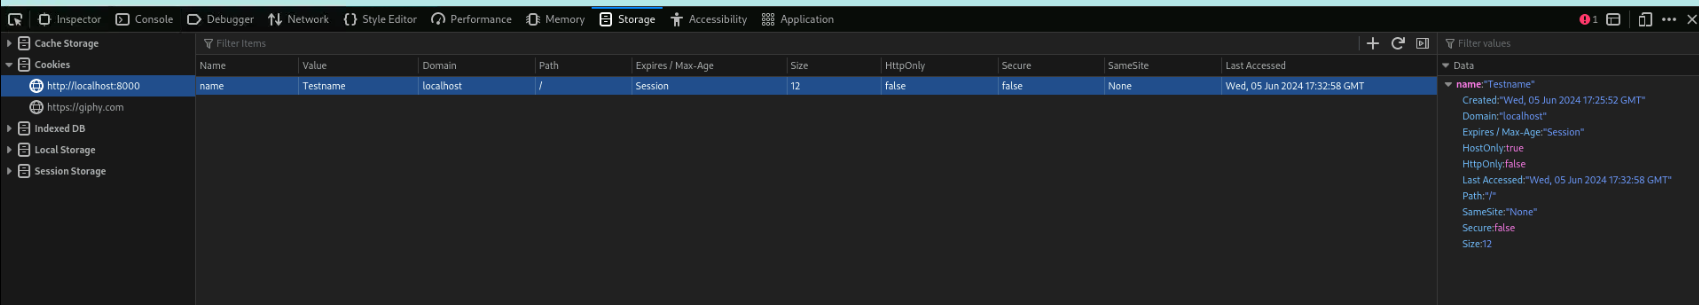
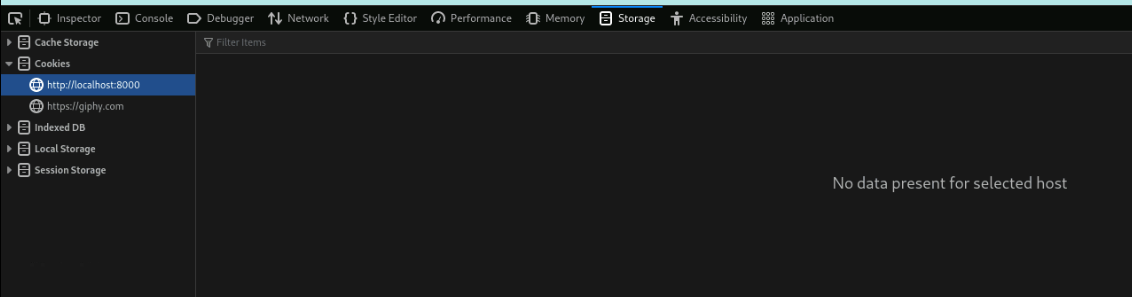
Storage Inspector
On the left hand side of this screen is the “Storage tree”, which lists all the storage types that can be inspected. Objects under each type are organized by origin. In our output, we only have two origins (http://localhost:8000 and https://giphy.com)
Expand the Cookies storage type. Note that our two origins are there, but we cannot see any cookies.
Back on the web page (http://localhost:8000/view_feedback), click the link below the GIF to give feedback.
- Enter the Username
studentand PasswordFortinet1!and select Sign In - Type a name and some feedback into the appropriate boxes and click Submit
- Enter the Username
Back on the Storage tree, expand the Cookies Section and you will notice that you now have a cooked with a key/value of “name/whatever name you entered” in the “Table Widget” to the right of the Storage Tree
Click on the new cookie. You will notice a new “Sidebar” pop up to the right of the Table Widget. This contains more detailed information about the cookie.