Use Case 7: Dashboard
The Dashboard
For the last use case we figured we would take it easy on you.
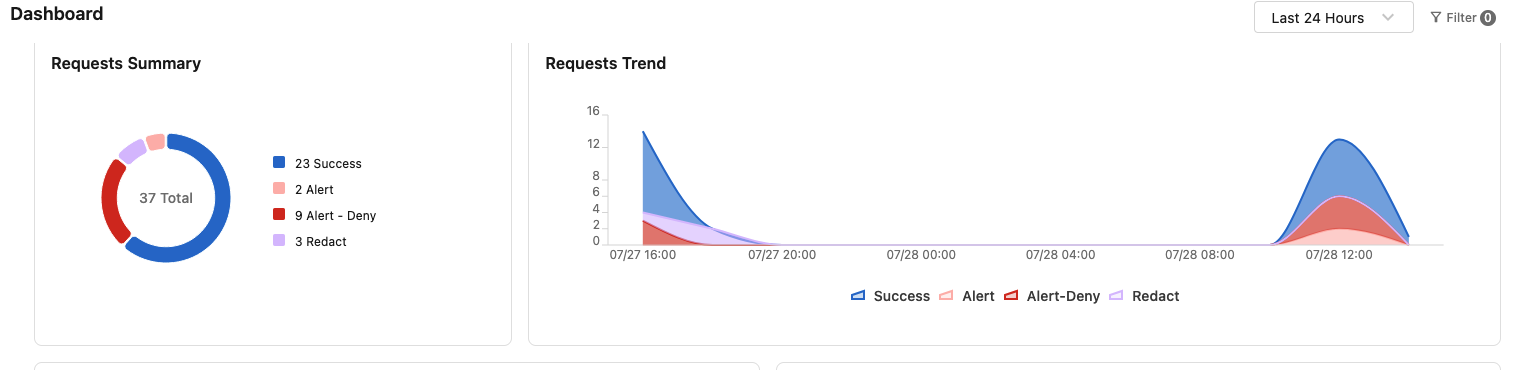
The dashboard is the main landing page in the FortiAIGate and the one that customers often see the most value in. There isn’t too much to show here, but it is important to customers when demoing the product. It is something that a lot of customers feel they lack: visibility into the AI usage and the dashboard provides them that visibility.
How to Use It
It is probably best to touch on it when you first load the FortiAIGate, and then come back it once you have completed your demo. With the demo completed you will see a lot more information populated in the interface and it offers more information.
Log into the FortiAIGate with the username
adminand the passwordFortinet123!.Click on the Dashboard.
Hover over the various pieces of information displayed within the charts to get more information about each area.
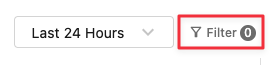
In the top right corner click on “Filter”.
Click on “Add New Filter”.
In the “Select…” box select “AI Flow”.
In the next select box select “Is”.
In the last select box select" “Intelligent Routing Example”.
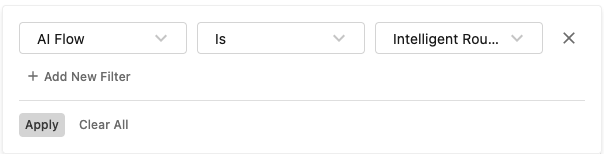
Click on Apply.
The dashboard will update to show only the information from the selected AI Flow.
Wrapping Up
That is all the information that is currently available on the FortiAIGate dashboard. This concludes this section of the lab. Congrats!

All done!
You have completed the current demo.